# CPU usage of version 6.0.0
**URL:** https://forum.suricata.io/t/cpu-usage-of-version-6-0-0/706
**Category:** Help
**Created:** [October 13, 2020, 10:21am UTC](https://forum.suricata.io/t/cpu-usage-of-version-6-0-0/706 "2020-10-13T10:21:16Z")
**Posts on this page:** 20
**Page:** 1
### Author:  [@Jungho](https://forum.suricata.io/u/Jungho)
#### Post date: [October 13, 2020, 10:21am UTC](https://forum.suricata.io/t/cpu-usage-of-version-6-0-0/706/1 "2020-10-13T10:21:16Z")
Hello Team.
In suricata 6.0.0, is there any change in CPU usage unlike the previous version?
This time I installed suricata 6.0.0 and newly configured suricata.yaml. However, even though there were no packets being processed by suricata, CPU usage continued to occur. I initially understood it as a suricata.yaml setup problem. However, when running the same suricata.yaml with version 5.0.4, there was no apparent CPU usage in idle state.
As I change several settings, I guess the CPU usage is related to the management-CPU. As the number of threads (managers/recyclers) of flow configuration increased, CPU usage increased accordingly. and in CPU-affinity, CPU load increased as management-CPU increased.
※ root@suricata-perf: Guest VM (fedora 32)
※ root@kvm: Host KVM (CentOS 8.2 2004)
1. (v6.0.0)2\_Flow\_Threads,2\_Affinity\_management-CPU
2. (v6.0.0)2\_Flow\_Threads,4\_Affinity\_management-CPU
3. (v5.0.4)2\_Flow\_Threads,4\_Affinity\_management-CPU
I am using suricata by configuring CPU information and NIC passthrough in qemu-kvm. The qemu-KVM configuration is constantly being modified, but CPU usage in the idle state of 6.0.0 installed in the Guest VM is putting a lot of load on the host PC such as CPU polling. Version 6.0.0, which was simply configured in Hyper-V, also caused some CPU usage in idle. However, it is not the same situation as qemu-KVM’s CPU polling.
This is not a request for help with qemu-KVM. I just want to know that version 6.0.0 has more CPU usage than version 5.0 when it is idle.
I need help with the above.
[suricata.yaml](https://forum.suricata.io/uploads/short-url/8T71q9a2209TLmsE5XRMff1Rqy2.yaml) (71.3 KB)
---
### Author:  [@Andreas\_Herz](https://forum.suricata.io/u/Andreas_Herz)
#### Post date: [October 17, 2020, 6:53pm UTC](https://forum.suricata.io/t/cpu-usage-of-version-6-0-0/706/2 "2020-10-17T18:53:40Z")
Could you run `perf top -p $(pidof suricata)` in both scenarios? that might give us a hint if there is an overhead on cpu usage.
---
### Author:  [@Jungho](https://forum.suricata.io/u/Jungho)
#### Post date: [October 17, 2020, 9:22pm UTC](https://forum.suricata.io/t/cpu-usage-of-version-6-0-0/706/3 "2020-10-17T21:22:13Z")
The both scenario results are the results 30 seconds after the command is executed.
5.0.4 flow manager:2, affinity 2

6.0.0 flow manager:2, affinity 2

The Event Count of the 6.0.0 version _perf_ result was much higher.
---
### Author:  [@Andreas\_Herz](https://forum.suricata.io/u/Andreas_Herz)
#### Post date: [October 22, 2020, 8:20pm UTC](https://forum.suricata.io/t/cpu-usage-of-version-6-0-0/706/4 "2020-10-22T20:20:26Z")
Are both outputs the same for a longer period of time while traffic is inspected?
---
### Author:  [@Jungho](https://forum.suricata.io/u/Jungho)
#### Post date: [October 23, 2020, 11:15am UTC](https://forum.suricata.io/t/cpu-usage-of-version-6-0-0/706/5 "2020-10-23T11:15:24Z")
The aggregated numbers were different, but the 6.0.0 version was higher.
I connected the client and server and tested it using iperf3.
**Throughput** (iperf3 -c _$SERVER\_IP_ -p 443 -T 100 -P 100 / iperf3 -s -p 443)
- Client-Server Loopback (9.41G)
- 6.0.0 (9.40 ~ 9.41)
- 5.0.4 (9.34 ~ 9.38)
**Common setting**
- flow manager:2, affinity:2
- enable stats (interval 10s)
- Loaded rule ( zero )
- Suricata Multi Queue: 10
- Intel-x540 T2 \* 2
- Interface settings such as offload off followed the _High Performance Configuration_ in the manual.
**5.0.4 perf**

**5.0.4 stats**

**6.0.0 perf**

**6.0.0 stats**

---
### Author:  [@Jungho](https://forum.suricata.io/u/Jungho)
#### Post date: [November 23, 2020, 12:12pm UTC](https://forum.suricata.io/t/cpu-usage-of-version-6-0-0/706/6 "2020-11-23T12:12:31Z")
How is the above problem going?
---
### Author:  [@Andreas\_Herz](https://forum.suricata.io/u/Andreas_Herz)
#### Post date: [November 23, 2020, 8:15pm UTC](https://forum.suricata.io/t/cpu-usage-of-version-6-0-0/706/7 "2020-11-23T20:15:11Z")
Both outputs look quite close, so hard to tell without further details.
---
### Author:  [@Jungho](https://forum.suricata.io/u/Jungho)
#### Post date: [November 24, 2020, 12:30am UTC](https://forum.suricata.io/t/cpu-usage-of-version-6-0-0/706/8 "2020-11-24T00:30:47Z")
This case also seems to be a similar problem in kvm.
> **[Bug #4096: Ubuntu 20.04 PPA upgraded to Suricata 6 now @ 200% CPU with no...](https://redmine.openinfosecfoundation.org/issues/4096)**
Is there any way to provide more details?
---
### Author:  [@pevma](https://forum.suricata.io/u/pevma)
#### Post date: [November 24, 2020, 7:30am UTC](https://forum.suricata.io/t/cpu-usage-of-version-6-0-0/706/9 "2020-11-24T07:30:55Z")
Can you please try to run perf top on the specific pegged CPUs and share what it shows ?
for example:
```auto
perf top -C 1 -g -K
perf top -C 2 -g -K
```
where `-C 2` is the 3rd CPU - aka 0,1,2 - in the htop screenshots above it will be cpu 3 (but for `perf top -C` it is `2`)
---
### Author:  [@Jungho](https://forum.suricata.io/u/Jungho)
#### Post date: [November 25, 2020, 8:38am UTC](https://forum.suricata.io/t/cpu-usage-of-version-6-0-0/706/10 "2020-11-25T08:38:27Z")
I modified suricata.yaml for accurate results. I adjusted the thread of flow: to 1 and assigned the management-cpu of cpu-affinity to cpu: [0] only. It proceeded without traffic. Please tell me if you need further testing.
In suricata, CPU 0 is a thread that looks like polling for information(htop) in KVM.
```auto
[root@suricata-perf ~]#perf top -C 0 -g -K
```

Both results are aggregated for about 30 seconds after running each version.
Doesn’t this happen in other kvm environments? (Different OS or different versions of libraries, etc.)
---
### Author:  [@pevma](https://forum.suricata.io/u/pevma)
#### Post date: [November 25, 2020, 12:11pm UTC](https://forum.suricata.io/t/cpu-usage-of-version-6-0-0/706/11 "2020-11-25T12:11:30Z")
It seems the flow section has too big of a settings.
```auto
flow:
memcap: 4096mb
hash-size: 4000000
prealloc: 2000000
emergency-recovery: 10
managers: 2 # default to one flow manager
recyclers: 2 # default to one flow recycler thread
```
can you revert those to the defaults here - [https://github.com/OISF/suricata/blob/master/suricata.yaml.in#L1179](https://github.com/OISF/suricata/blob/master/suricata.yaml.in#L1179) and try again to see if any difference?
---
### Author:  [@Jungho](https://forum.suricata.io/u/Jungho)
#### Post date: [November 25, 2020, 1:00pm UTC](https://forum.suricata.io/t/cpu-usage-of-version-6-0-0/706/12 "2020-11-25T13:00:13Z")
Yes. I set a large value while doing some tests.
I set it to the default value, but the result is the same. (CPU usage in KVM)
```auto
Suricata Configuration:
AF_PACKET support: yes
eBPF support: no
XDP support: no
PF_RING support: no
NFQueue support: no
NFLOG support: no
IPFW support: no
Netmap support: no
DAG enabled: no
Napatech enabled: no
WinDivert enabled: no
Unix socket enabled: yes
Detection enabled: yes
Libmagic support: yes
libnss support: yes
libnspr support: yes
libjansson support: yes
hiredis support: no
hiredis async with libevent: no
Prelude support: no
PCRE jit: yes
LUA support: no
libluajit: no
GeoIP2 support: no
Non-bundled htp: no
Old barnyard2 support:
Hyperscan support: yes
Libnet support: yes
liblz4 support: yes
Rust support: yes
Rust strict mode: no
Rust compiler path: /usr/bin/rustc
Rust compiler version: rustc 1.46.0
Cargo path: /usr/bin/cargo
Cargo version: cargo 1.46.0
Cargo vendor: yes
Python support: yes
Python path: /usr/bin/python3
Python distutils yes
Python yaml yes
Install suricatactl: yes
Install suricatasc: yes
Install suricata-update: yes
Profiling enabled: no
Profiling locks enabled: no
Plugin support (experimental): yes
Development settings:
Coccinelle / spatch: no
Unit tests enabled: no
Debug output enabled: no
Debug validation enabled: no
Generic build parameters:
Installation prefix: /usr
Configuration directory: /etc/suricata/
Log directory: /var/log/suricata/
--prefix /usr
--sysconfdir /etc
--localstatedir /var
--datarootdir /usr/share
Host: x86_64-pc-linux-gnu
Compiler: gcc (exec name) / g++ (real)
GCC Protect enabled: no
GCC march native enabled: yes
GCC Profile enabled: no
Position Independent Executable enabled: no
CFLAGS -g -O2 -std=c11 -march=native -I${srcdir}/../rust/gen -I${srcdir}/../rust/dist
PCAP_CFLAGS
SECCFLAGS
```
[suricata.yaml](https://forum.suricata.io/uploads/short-url/uXGZHyEkFz7jilYq1K6qq8GK8E6.yaml) (71.3 KB)
---
### Author:  [@pevma](https://forum.suricata.io/u/pevma)
#### Post date: [November 25, 2020, 3:21pm UTC](https://forum.suricata.io/t/cpu-usage-of-version-6-0-0/706/13 "2020-11-25T15:21:16Z")
It should show a diff - i would expect at least - as in the previously shared screenshots the CPUs that were busy were the ones with the Flow threads on.
Can you please re-share a screenshot of the perf top with the busy cpus please after you have done the config change ?
---
### Author:  [@Jungho](https://forum.suricata.io/u/Jungho)
#### Post date: [November 25, 2020, 10:32pm UTC](https://forum.suricata.io/t/cpu-usage-of-version-6-0-0/706/14 "2020-11-25T22:32:45Z")
Above we mainly used 2 threads and affinity for this. Is it correct to mean this?
```auto
flow:
memcap: 128mb
hash-size: 65536
prealloc: 10000
emergency-recovery: 10
managers: 2 # default to one flow manager
recyclers: 2 # default to one flow recycler thread
```
```auto
# Runmode the engine should use. Please check --list-runmodes to get the available
# runmodes for each packet acquisition method. Default depends on selected capture
# method. 'workers' generally gives best performance.
runmode: workers
```
```auto
# Suricata is multi-threaded. Here the threading can be influenced.
threading:
set-cpu-affinity: yes
# Tune cpu affinity of threads. Each family of threads can be bound
# to specific CPUs.
#
# These 2 apply to the all runmodes:
# management-cpu-set is used for flow timeout handling, counters
# worker-cpu-set is used for 'worker' threads
#
# Additionally, for autofp these apply:
# receive-cpu-set is used for capture threads
# verdict-cpu-set is used for IPS verdict threads
#
cpu-affinity:
- management-cpu-set:
cpu: ["0", "1"] # include only these CPUs in affinity settings
```
In this setting, the result was as shown in the attached picture.
**5.0.4**

**6.0.0**

If necessary, it can be operated entirely in the OS or remotely connected.
---
### Author:  [@pevma](https://forum.suricata.io/u/pevma)
#### Post date: [November 26, 2020, 12:20pm UTC](https://forum.suricata.io/t/cpu-usage-of-version-6-0-0/706/15 "2020-11-26T12:20:35Z")
Thank you for the update.
In the screenshots above for 6.0.0 the `perf top` commands are for CPU 0 and 1.
Judging by the htop output (pegged CPUs are 3 and 15 in htop) we actually need
`perf top -C 2 -g -K`
and
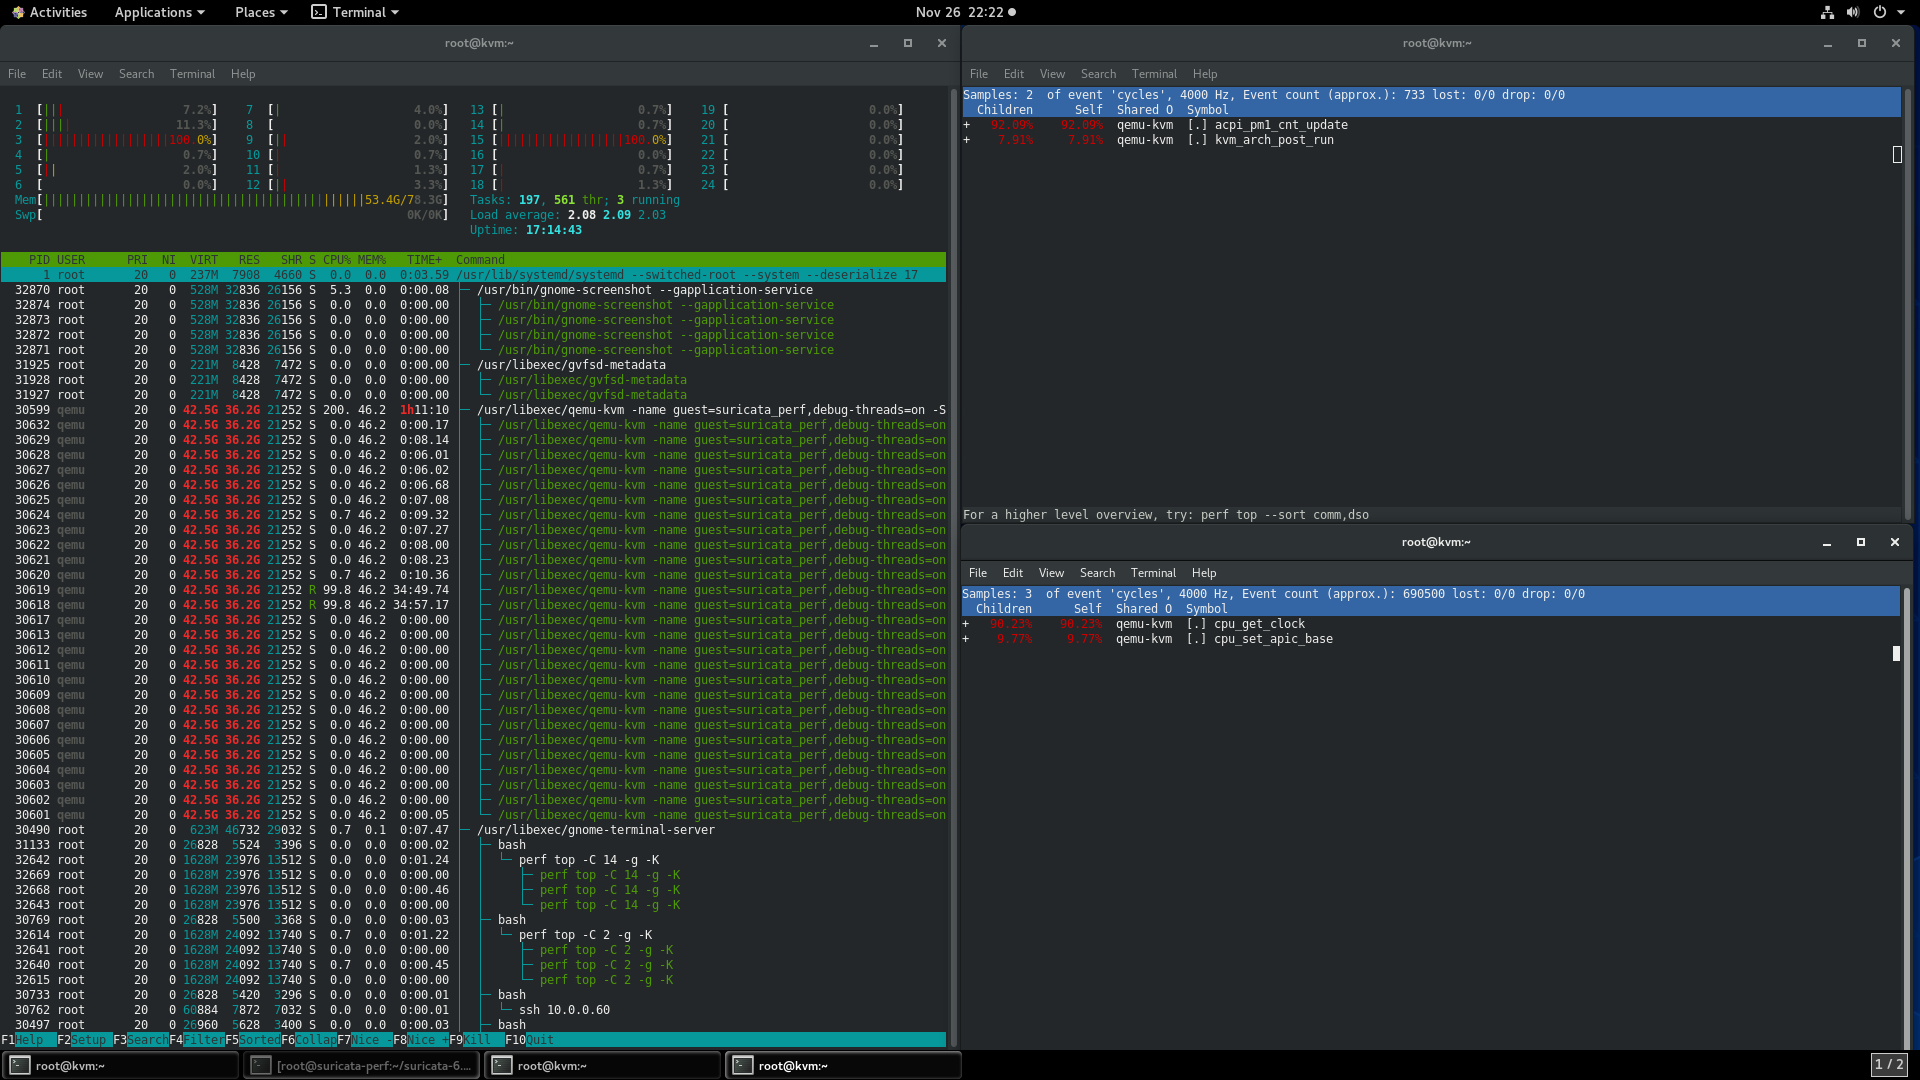
`perf top -C 14 -g -K` on the `root@kvm~` host (not Suricata VM guest) to get an idea of what the problem might be.
Can you please share that for 6.0.0 ?
Thank you
---
### Author:  [@Jungho](https://forum.suricata.io/u/Jungho)
#### Post date: [November 26, 2020, 1:49pm UTC](https://forum.suricata.io/t/cpu-usage-of-version-6-0-0/706/16 "2020-11-26T13:49:36Z")
Oh sorry. With 6.0.0 running, I checked the information of the KVM Host again. In all figures, the top terminal is CPU #2 (htop #3) and the bottom is #14 (htop #15).


---
### Author:  [@vjulien](https://forum.suricata.io/u/vjulien)
#### Post date: [November 30, 2020, 7:31am UTC](https://forum.suricata.io/t/cpu-usage-of-version-6-0-0/706/17 "2020-11-30T07:31:26Z")
The main loops in the flow manager and recycler threads switched from a pthread condition wait to a simpler `usleep` loop. Wonder if that is what works poorly with kvm.
---
### Author:  [@Jungho](https://forum.suricata.io/u/Jungho)
#### Post date: [December 5, 2020, 1:28pm UTC](https://forum.suricata.io/t/cpu-usage-of-version-6-0-0/706/18 "2020-12-05T13:28:02Z")
Even in kvm of fedora33, only 6.0.x versions, including 6.0.1, increased CPU usage. If so, has something changed in pthread condition from 6.0.0?
---
### Author:  [@vjulien](https://forum.suricata.io/u/vjulien)
#### Post date: [December 6, 2020, 5:05pm UTC](https://forum.suricata.io/t/cpu-usage-of-version-6-0-0/706/19 "2020-12-06T17:05:50Z")
Yes, in 6 flow manager loops switched from pthread conditions to usleep. The pthread conditions gave very unreliable results in my tests.
---
### Author:  [@Jungho](https://forum.suricata.io/u/Jungho)
#### Post date: [December 6, 2020, 5:20pm UTC](https://forum.suricata.io/t/cpu-usage-of-version-6-0-0/706/20 "2020-12-06T17:20:30Z")
Can you explain specifically what it means to be unreliable results?
[Next page](https://forum.suricata.io/t/cpu-usage-of-version-6-0-0/706.md?page=2)