CPU usage of version 6.0.0

Hello Team.

In suricata 6.0.0, is there any change in CPU usage unlike the previous version?

This time I installed suricata 6.0.0 and newly configured suricata.yaml. However, even though there were no packets being processed by suricata, CPU usage continued to occur. I initially understood it as a suricata.yaml setup problem. However, when running the same suricata.yaml with version 5.0.4, there was no apparent CPU usage in idle state.

As I change several settings, I guess the CPU usage is related to the management-CPU. As the number of threads (managers/recyclers) of flow configuration increased, CPU usage increased accordingly. and in CPU-affinity, CPU load increased as management-CPU increased.

※ root@suricata-perf: Guest VM (fedora 32)
※ root@kvm: Host KVM (CentOS 8.2 2004)

  1. (v6.0.0)2_Flow_Threads,2_Affinity_management-CPU

  2. (v6.0.0)2_Flow_Threads,4_Affinity_management-CPU

  3. (v5.0.4)2_Flow_Threads,4_Affinity_management-CPU

I am using suricata by configuring CPU information and NIC passthrough in qemu-kvm. The qemu-KVM configuration is constantly being modified, but CPU usage in the idle state of 6.0.0 installed in the Guest VM is putting a lot of load on the host PC such as CPU polling. Version 6.0.0, which was simply configured in Hyper-V, also caused some CPU usage in idle. However, it is not the same situation as qemu-KVM’s CPU polling.

This is not a request for help with qemu-KVM. I just want to know that version 6.0.0 has more CPU usage than version 5.0 when it is idle.

I need help with the above.

suricata.yaml (71.3 KB)

Could you run perf top -p $(pidof suricata) in both scenarios? that might give us a hint if there is an overhead on cpu usage.

The both scenario results are the results 30 seconds after the command is executed.

5.0.4 flow manager:2, affinity 2

6.0.0 flow manager:2, affinity 2

The Event Count of the 6.0.0 version perf result was much higher.

Are both outputs the same for a longer period of time while traffic is inspected?

The aggregated numbers were different, but the 6.0.0 version was higher.
I connected the client and server and tested it using iperf3.

Throughput (iperf3 -c $SERVER_IP -p 443 -T 100 -P 100 / iperf3 -s -p 443)

  • Client-Server Loopback (9.41G)
  • 6.0.0 (9.40 ~ 9.41)
  • 5.0.4 (9.34 ~ 9.38)

Common setting

  • flow manager:2, affinity:2
  • enable stats (interval 10s)
  • Loaded rule ( zero )
  • Suricata Multi Queue: 10
  • Intel-x540 T2 * 2
  • Interface settings such as offload off followed the High Performance Configuration in the manual.

5.0.4 perf

5.0.4 stats
5.0.4_stats

6.0.0 perf

6.0.0 stats

How is the above problem going?

Both outputs look quite close, so hard to tell without further details.

This case also seems to be a similar problem in kvm.


Is there any way to provide more details?

Can you please try to run perf top on the specific pegged CPUs and share what it shows ?
for example:

perf top -C 1 -g -K
perf top -C 2 -g -K

where -C 2 is the 3rd CPU - aka 0,1,2 - in the htop screenshots above it will be cpu 3 (but for perf top -C it is 2)

I modified suricata.yaml for accurate results. I adjusted the thread of flow: to 1 and assigned the management-cpu of cpu-affinity to cpu: [ 0 ] only. It proceeded without traffic. Please tell me if you need further testing.

In suricata, CPU 0 is a thread that looks like polling for information(htop) in KVM.

[root@suricata-perf ~]#perf top -C 0 -g -K

Both results are aggregated for about 30 seconds after running each version.
Doesn’t this happen in other kvm environments? (Different OS or different versions of libraries, etc.)

It seems the flow section has too big of a settings.

flow:
  memcap: 4096mb
  hash-size: 4000000
  prealloc: 2000000
  emergency-recovery: 10
  managers: 2 # default to one flow manager
  recyclers: 2 # default to one flow recycler thread

can you revert those to the defaults here - https://github.com/OISF/suricata/blob/master/suricata.yaml.in#L1179 and try again to see if any difference?

Yes. I set a large value while doing some tests.
I set it to the default value, but the result is the same. (CPU usage in KVM)

Suricata Configuration:
  AF_PACKET support:                       yes
  eBPF support:                            no
  XDP support:                             no
  PF_RING support:                         no
  NFQueue support:                         no
  NFLOG support:                           no
  IPFW support:                            no
  Netmap support:                          no
  DAG enabled:                             no
  Napatech enabled:                        no
  WinDivert enabled:                       no

  Unix socket enabled:                     yes
  Detection enabled:                       yes

  Libmagic support:                        yes
  libnss support:                          yes
  libnspr support:                         yes
  libjansson support:                      yes
  hiredis support:                         no
  hiredis async with libevent:             no
  Prelude support:                         no
  PCRE jit:                                yes
  LUA support:                             no
  libluajit:                               no
  GeoIP2 support:                          no
  Non-bundled htp:                         no
  Old barnyard2 support:
  Hyperscan support:                       yes
  Libnet support:                          yes
  liblz4 support:                          yes

  Rust support:                            yes
  Rust strict mode:                        no
  Rust compiler path:                      /usr/bin/rustc
  Rust compiler version:                   rustc 1.46.0
  Cargo path:                              /usr/bin/cargo
  Cargo version:                           cargo 1.46.0
  Cargo vendor:                            yes

  Python support:                          yes
  Python path:                             /usr/bin/python3
  Python distutils                         yes
  Python yaml                              yes
  Install suricatactl:                     yes
  Install suricatasc:                      yes
  Install suricata-update:                 yes

  Profiling enabled:                       no
  Profiling locks enabled:                 no

  Plugin support (experimental):           yes

Development settings:
  Coccinelle / spatch:                     no
  Unit tests enabled:                      no
  Debug output enabled:                    no
  Debug validation enabled:                no

Generic build parameters:
  Installation prefix:                     /usr
  Configuration directory:                 /etc/suricata/
  Log directory:                           /var/log/suricata/

  --prefix                                 /usr
  --sysconfdir                             /etc
  --localstatedir                          /var
  --datarootdir                            /usr/share

  Host:                                    x86_64-pc-linux-gnu
  Compiler:                                gcc (exec name) / g++ (real)
  GCC Protect enabled:                     no
  GCC march native enabled:                yes
  GCC Profile enabled:                     no
  Position Independent Executable enabled: no
  CFLAGS                                   -g -O2 -std=c11 -march=native -I${srcdir}/../rust/gen -I${srcdir}/../rust/dist
  PCAP_CFLAGS
  SECCFLAGS

suricata.yaml (71.3 KB)

It should show a diff - i would expect at least - as in the previously shared screenshots the CPUs that were busy were the ones with the Flow threads on.
Can you please re-share a screenshot of the perf top with the busy cpus please after you have done the config change ?

Above we mainly used 2 threads and affinity for this. Is it correct to mean this?

flow:
  memcap: 128mb
  hash-size: 65536
  prealloc: 10000
  emergency-recovery: 10
  managers: 2 # default to one flow manager
  recyclers: 2 # default to one flow recycler thread
# Runmode the engine should use. Please check --list-runmodes to get the available
# runmodes for each packet acquisition method. Default depends on selected capture
# method. 'workers' generally gives best performance.
runmode: workers
# Suricata is multi-threaded. Here the threading can be influenced.
threading:
  set-cpu-affinity: yes
  # Tune cpu affinity of threads. Each family of threads can be bound
  # to specific CPUs.
  #
  # These 2 apply to the all runmodes:
  # management-cpu-set is used for flow timeout handling, counters
  # worker-cpu-set is used for 'worker' threads
  #
  # Additionally, for autofp these apply:
  # receive-cpu-set is used for capture threads
  # verdict-cpu-set is used for IPS verdict threads
  #
  cpu-affinity:
    - management-cpu-set:
        cpu: [ "0", "1" ]  # include only these CPUs in affinity settings

In this setting, the result was as shown in the attached picture.

5.0.4

6.0.0

If necessary, it can be operated entirely in the OS or remotely connected.

Thank you for the update.
In the screenshots above for 6.0.0 the perf top commands are for CPU 0 and 1.
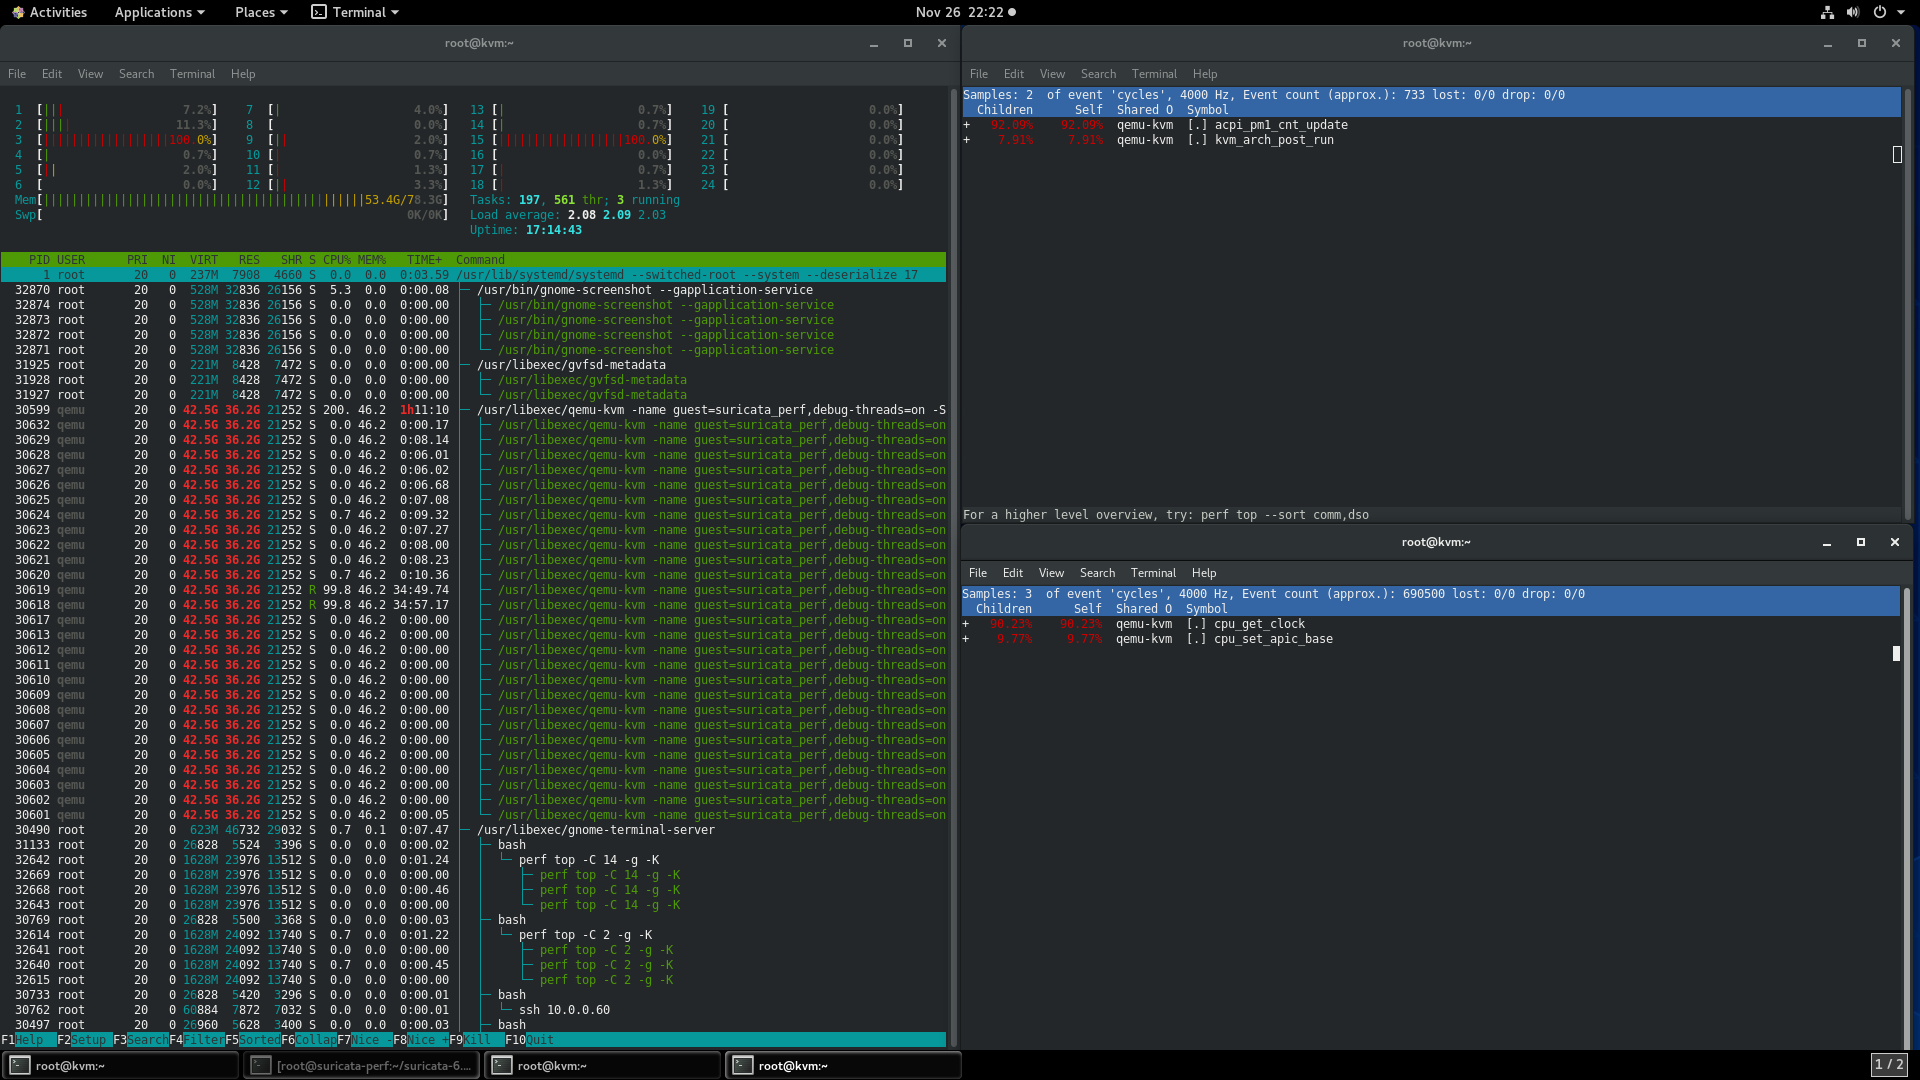
Judging by the htop output (pegged CPUs are 3 and 15 in htop) we actually need
perf top -C 2 -g -K
and
perf top -C 14 -g -K on the root@kvm~ host (not Suricata VM guest) to get an idea of what the problem might be.
Can you please share that for 6.0.0 ?

Thank you

Oh sorry. With 6.0.0 running, I checked the information of the KVM Host again. In all figures, the top terminal is CPU #2 (htop #3) and the bottom is #14 (htop #15).

The main loops in the flow manager and recycler threads switched from a pthread condition wait to a simpler usleep loop. Wonder if that is what works poorly with kvm.

Even in kvm of fedora33, only 6.0.x versions, including 6.0.1, increased CPU usage. If so, has something changed in pthread condition from 6.0.0?

Yes, in 6 flow manager loops switched from pthread conditions to usleep. The pthread conditions gave very unreliable results in my tests.

Can you explain specifically what it means to be unreliable results?