My NIC
00:11.0 Ethernet controller: Intel Corporation 82599ES 10-Gigabit SFI/SFP+ Network Connection (rev 01)
Suricata.yml
cat /etc/suricata/suricata.yaml
%YAML 1.1
---
# Suricata configuration file. In addition to the comments describing all
# options in this file, full documentation can be found at:
# https://suricata.readthedocs.io/en/latest/configuration/suricata-yaml.html
##
## Step 1: Inform Suricata about your network
##
vars:
# more specific is better for alert accuracy and performance
address-groups:
HOME_NET: "[192.168.0.0/16,10.0.0.0/8,172.16.0.0/12]"
#HOME_NET: "[192.168.0.0/16]"
#HOME_NET: "[10.0.0.0/8]"
#HOME_NET: "[172.16.0.0/12]"
#HOME_NET: "any"
EXTERNAL_NET: "!$HOME_NET"
#EXTERNAL_NET: "any"
HTTP_SERVERS: "$HOME_NET"
SMTP_SERVERS: "$HOME_NET"
SQL_SERVERS: "$HOME_NET"
DNS_SERVERS: "$HOME_NET"
TELNET_SERVERS: "$HOME_NET"
AIM_SERVERS: "$EXTERNAL_NET"
DC_SERVERS: "$HOME_NET"
DNP3_SERVER: "$HOME_NET"
DNP3_CLIENT: "$HOME_NET"
MODBUS_CLIENT: "$HOME_NET"
MODBUS_SERVER: "$HOME_NET"
ENIP_CLIENT: "$HOME_NET"
ENIP_SERVER: "$HOME_NET"
port-groups:
HTTP_PORTS: "80"
SHELLCODE_PORTS: "!80"
ORACLE_PORTS: 1521
SSH_PORTS: 22
DNP3_PORTS: 20000
MODBUS_PORTS: 502
FILE_DATA_PORTS: "[$HTTP_PORTS,110,143]"
FTP_PORTS: 21
GENEVE_PORTS: 6081
VXLAN_PORTS: 4789
TEREDO_PORTS: 3544
##
## Step 2: Select outputs to enable
##
# The default logging directory. Any log or output file will be
# placed here if it's not specified with a full path name. This can be
# overridden with the -l command line parameter.
default-log-dir: /var/log/suricata/
# Global stats configuration
stats:
enabled: yes
# The interval field (in seconds) controls the interval at
# which stats are updated in the log.
interval: 8
# Add decode events to stats.
#decoder-events: true
# Decoder event prefix in stats. Has been 'decoder' before, but that leads
# to missing events in the eve.stats records. See issue #2225.
#decoder-events-prefix: "decoder.event"
# Add stream events as stats.
#stream-events: false
# Plugins -- Experimental -- specify the filename for each plugin shared object
plugins:
# - /path/to/plugin.so
# Configure the type of alert (and other) logging you would like.
outputs:
# a line based alerts log similar to Snort's fast.log
- fast:
enabled: yes
filename: fast.log
append: yes
#filetype: regular # 'regular', 'unix_stream' or 'unix_dgram'
# Extensible Event Format (nicknamed EVE) event log in JSON format
- eve-log:
enabled: yes
filetype: regular #regular|syslog|unix_dgram|unix_stream|redis
filename: eve.json
pcap-file: false
community-id: false
# Seed value for the ID output. Valid values are 0-65535.
community-id-seed: 0
xff:
enabled: no
# Two operation modes are available: "extra-data" and "overwrite".
mode: extra-data
# Two proxy deployments are supported: "reverse" and "forward". In
# a "reverse" deployment the IP address used is the last one, in a
# "forward" deployment the first IP address is used.
deployment: reverse
# Header name where the actual IP address will be reported. If more
# than one IP address is present, the last IP address will be the
# one taken into consideration.
header: X-Forwarded-For
types:
- alert:
tagged-packets: yes
- anomaly:
enabled: yes
#
# Choose one or more types of anomaly logging and whether to enable
# logging of the packet header for packet anomalies.
types:
# decode: no
# stream: no
# applayer: yes
#packethdr: no
- http:
extended: yes
- dns:
- tls:
extended: yes
- files:
force-magic: no # force logging magic on all logged files
# force logging of checksums, available hash functions are md5,
# sha1 and sha256
#force-hash: [md5]
#- drop:
# alerts: yes # log alerts that caused drops
# flows: all # start or all: 'start' logs only a single drop
# # per flow direction. All logs each dropped pkt.
- smtp:
#- dnp3
- ftp
- rdp
- nfs
- smb
- tftp
- ike
- dcerpc
- krb5
- snmp
- rfb
- sip
- dhcp:
enabled: yes
extended: no
- ssh
- mqtt:
# passwords: yes # enable output of passwords
# HTTP2 logging. HTTP2 support is currently experimental and
# disabled by default. To enable, uncomment the following line
# and be sure to enable http2 in the app-layer section.
#- http2
- stats:
totals: yes # stats for all threads merged together
threads: no # per thread stats
deltas: no # include delta values
# bi-directional flows
- flow
# uni-directional flows
#- netflow
# Metadata event type. Triggered whenever a pktvar is saved
# and will include the pktvars, flowvars, flowbits and
# flowints.
#- metadata
# a line based log of HTTP requests (no alerts)
- http-log:
enabled: no
filename: http.log
append: yes
- tls-log:
enabled: no # Log TLS connections.
filename: tls.log # File to store TLS logs.
append: yes
- tls-store:
enabled: no
#certs-log-dir: certs # directory to store the certificates files
- pcap-log:
enabled: no
filename: log.pcap
# File size limit. Can be specified in kb, mb, gb. Just a number
# is parsed as bytes.
limit: 1000mb
# If set to a value, ring buffer mode is enabled. Will keep maximum of
# "max-files" of size "limit"
max-files: 2000
compression: none
mode: normal # normal, multi or sguil.
use-stream-depth: no #If set to "yes" packets seen after reaching stream inspection depth are ignored. "no" logs all packets
honor-pass-rules: no # If set to "yes", flows in which a pass rule matched will stop being logged.
# a full alert log containing much information for signature writers
# or for investigating suspected false positives.
- alert-debug:
enabled: no
filename: alert-debug.log
append: yes
#filetype: regular # 'regular', 'unix_stream' or 'unix_dgram'
# alert output to prelude (https://www.prelude-siem.org/) only
# available if Suricata has been compiled with --enable-prelude
- alert-prelude:
enabled: no
profile: suricata
log-packet-content: no
log-packet-header: yes
# Stats.log contains data from various counters of the Suricata engine.
- stats:
enabled: yes
filename: stats.log
append: yes # append to file (yes) or overwrite it (no)
totals: yes # stats for all threads merged together
threads: no # per thread stats
#null-values: yes # print counters that have value 0. Default: no
# a line based alerts log similar to fast.log into syslog
- syslog:
enabled: no
# reported identity to syslog. If omitted the program name (usually
# suricata) will be used.
#identity: "suricata"
facility: local5
#level: Info ## possible levels: Emergency, Alert, Critical,
## Error, Warning, Notice, Info, Debug
- file-store:
version: 2
enabled: no
xff:
enabled: no
# Two operation modes are available, "extra-data" and "overwrite".
mode: extra-data
# Two proxy deployments are supported, "reverse" and "forward". In
# a "reverse" deployment the IP address used is the last one, in a
# "forward" deployment the first IP address is used.
deployment: reverse
# Header name where the actual IP address will be reported. If more
# than one IP address is present, the last IP address will be the
# one taken into consideration.
header: X-Forwarded-For
# Log TCP data after stream normalization
# Two types: file or dir:
# - file logs into a single logfile.
# - dir creates 2 files per TCP session and stores the raw TCP
# data into them.
# Use 'both' to enable both file and dir modes.
#
# Note: limited by "stream.reassembly.depth"
- tcp-data:
enabled: no
type: file
filename: tcp-data.log
- http-body-data:
enabled: no
type: file
filename: http-data.log
# Lua Output Support - execute lua script to generate alert and event
# output.
# Documented at:
# https://suricata.readthedocs.io/en/latest/output/lua-output.html
- lua:
enabled: no
#scripts-dir: /etc/suricata/lua-output/
scripts:
# - script1.lua
# Logging configuration. This is not about logging IDS alerts/events, but
# output about what Suricata is doing, like startup messages, errors, etc.
logging:
# The default log level: can be overridden in an output section.
# Note that debug level logging will only be emitted if Suricata was
# compiled with the --enable-debug configure option.
#
# This value is overridden by the SC_LOG_LEVEL env var.
default-log-level: notice
default-output-filter:
# Define your logging outputs. If none are defined, or they are all
# disabled you will get the default: console output.
outputs:
- console:
enabled: yes
# type: json
- file:
enabled: yes
level: info
filename: suricata.log
# type: json
- syslog:
enabled: no
facility: local5
format: "[%i] <%d> -- "
# type: json
##
## Step 3: Configure common capture settings
##
## See "Advanced Capture Options" below for more options, including Netmap
## and PF_RING.
##
# Linux high speed capture support
af-packet:
- interface: eth0
# Number of receive threads. "auto" uses the number of cores
#threads: auto
# Default clusterid. AF_PACKET will load balance packets based on flow.
cluster-id: 99
cluster-type: cluster_flow
# In some fragmentation cases, the hash can not be computed. If "defrag" is set
# to yes, the kernel will do the needed defragmentation before sending the packets.
defrag: yes
# Put default values here. These will be used for an interface that is not
# in the list above.
- interface: default
#threads: auto
#use-mmap: no
#tpacket-v3: yes
# Cross platform libpcap capture support
pcap:
- interface: eth0
# Put default values here
- interface: default
#checksum-checks: auto
# Settings for reading pcap files
pcap-file:
checksum-checks: auto
app-layer:
protocols:
rfb:
enabled: yes
detection-ports:
dp: 5900, 5901, 5902, 5903, 5904, 5905, 5906, 5907, 5908, 5909
mqtt:
enabled: yes
# max-msg-length: 1mb
# subscribe-topic-match-limit: 100
# unsubscribe-topic-match-limit: 100
krb5:
enabled: yes
snmp:
enabled: yes
ike:
enabled: yes
tls:
enabled: yes
detection-ports:
dp: 443
# Generate JA3 fingerprint from client hello. If not specified it
# will be disabled by default, but enabled if rules require it.
#ja3-fingerprints: auto
# What to do when the encrypted communications start:
# - default: keep tracking TLS session, check for protocol anomalies,
# inspect tls_* keywords. Disables inspection of unmodified
# 'content' signatures.
# - bypass: stop processing this flow as much as possible. No further
# TLS parsing and inspection. Offload flow bypass to kernel
# or hardware if possible.
# - full: keep tracking and inspection as normal. Unmodified content
# keyword signatures are inspected as well.
#
# For best performance, select 'bypass'.
#
#encryption-handling: default
dcerpc:
enabled: yes
ftp:
enabled: yes
# memcap: 64mb
rdp:
#enabled: yes
ssh:
enabled: yes
#hassh: yes
# HTTP2: Experimental HTTP 2 support. Disabled by default.
http2:
enabled: no
smtp:
enabled: yes
raw-extraction: no
# Configure SMTP-MIME Decoder
mime:
# Decode MIME messages from SMTP transactions
# (may be resource intensive)
# This field supersedes all others because it turns the entire
# process on or off
decode-mime: yes
# Decode MIME entity bodies (ie. Base64, quoted-printable, etc.)
decode-base64: yes
decode-quoted-printable: yes
# Maximum bytes per header data value stored in the data structure
# (default is 2000)
header-value-depth: 2000
# Extract URLs and save in state data structure
extract-urls: yes
# Set to yes to compute the md5 of the mail body. You will then
# be able to journalize it.
body-md5: no
# Configure inspected-tracker for file_data keyword
inspected-tracker:
content-limit: 100000
content-inspect-min-size: 32768
content-inspect-window: 4096
imap:
enabled: detection-only
smb:
enabled: yes
detection-ports:
dp: 139, 445
# Stream reassembly size for SMB streams. By default track it completely.
#stream-depth: 0
nfs:
enabled: yes
tftp:
enabled: yes
dns:
tcp:
enabled: yes
detection-ports:
dp: 53
udp:
enabled: yes
detection-ports:
dp: 53
http:
enabled: yes
# memcap: Maximum memory capacity for HTTP
# Default is unlimited, values can be 64mb, e.g.
# default-config: Used when no server-config matches
# personality: List of personalities used by default
# request-body-limit: Limit reassembly of request body for inspection
# by http_client_body & pcre /P option.
# response-body-limit: Limit reassembly of response body for inspection
# by file_data, http_server_body & pcre /Q option.
#
# For advanced options, see the user guide
# server-config: List of server configurations to use if address matches
# address: List of IP addresses or networks for this block
# personality: List of personalities used by this block
#
# Then, all the fields from default-config can be overloaded
#
# Currently Available Personalities:
# Minimal, Generic, IDS (default), IIS_4_0, IIS_5_0, IIS_5_1, IIS_6_0,
# IIS_7_0, IIS_7_5, Apache_2
libhtp:
default-config:
personality: IDS
# Can be specified in kb, mb, gb. Just a number indicates
# it's in bytes.
request-body-limit: 100kb
response-body-limit: 100kb
# inspection limits
request-body-minimal-inspect-size: 32kb
request-body-inspect-window: 4kb
response-body-minimal-inspect-size: 40kb
response-body-inspect-window: 16kb
# response body decompression (0 disables)
response-body-decompress-layer-limit: 2
# auto will use http-body-inline mode in IPS mode, yes or no set it statically
http-body-inline: auto
# Decompress SWF files.
# Two types: 'deflate', 'lzma', 'both' will decompress deflate and lzma
# compress-depth:
# Specifies the maximum amount of data to decompress,
# set 0 for unlimited.
# decompress-depth:
# Specifies the maximum amount of decompressed data to obtain,
# set 0 for unlimited.
swf-decompression:
enabled: yes
type: both
compress-depth: 100kb
decompress-depth: 100kb
double-decode-path: no
double-decode-query: no
server-config:
modbus:
# How many unanswered Modbus requests are considered a flood.
# If the limit is reached, the app-layer-event:modbus.flooded; will match.
#request-flood: 500
enabled: no
detection-ports:
dp: 502
# According to MODBUS Messaging on TCP/IP Implementation Guide V1.0b, it
# is recommended to keep the TCP connection opened with a remote device
# and not to open and close it for each MODBUS/TCP transaction. In that
# case, it is important to set the depth of the stream reassembling as
# unlimited (stream.reassembly.depth: 0)
# Stream reassembly size for modbus. By default track it completely.
stream-depth: 0
# DNP3
dnp3:
enabled: no
detection-ports:
dp: 20000
# SCADA EtherNet/IP and CIP protocol support
enip:
enabled: no
detection-ports:
dp: 44818
sp: 44818
ntp:
enabled: yes
dhcp:
enabled: yes
sip:
#enabled: no
# Limit for the maximum number of asn1 frames to decode (default 256)
asn1-max-frames: 256
# Datasets default settings
coredump:
max-dump: unlimited
host-mode: auto
max-pending-packets: 9000
unix-command:
enabled: auto
#filename: custom.socket
# Magic file. The extension .mgc is added to the value here.
#magic-file: /usr/share/file/magic
#magic-file:
# GeoIP2 database file. Specify path and filename of GeoIP2 database
# if using rules with "geoip" rule option.
#geoip-database: /usr/local/share/GeoLite2/GeoLite2-Country.mmdb
legacy:
uricontent: enabled
engine-analysis:
# enables printing reports for fast-pattern for every rule.
rules-fast-pattern: yes
# enables printing reports for each rule
rules: yes
#recursion and match limits for PCRE where supported
pcre:
match-limit: 3500
match-limit-recursion: 1500
##
## Advanced Traffic Tracking and Reconstruction Settings
##
# Host specific policies for defragmentation and TCP stream
# reassembly. The host OS lookup is done using a radix tree, just
# like a routing table so the most specific entry matches.
host-os-policy:
# Make the default policy windows.
windows: [0.0.0.0/0]
bsd: []
bsd-right: []
old-linux: []
linux: []
old-solaris: []
solaris: []
hpux10: []
hpux11: []
irix: []
macos: []
vista: []
windows2k3: []
# Defrag settings:
defrag:
memcap: 32mb
hash-size: 65536
trackers: 65535 # number of defragmented flows to follow
max-frags: 65535 # number of fragments to keep (higher than trackers)
prealloc: yes
timeout: 60
# Enable defrag per host settings
# host-config:
#
# - dmz:
# timeout: 30
# address: [192.168.1.0/24, 127.0.0.0/8, 1.1.1.0/24, 2.2.2.0/24, "1.1.1.1", "2.2.2.2", "::1"]
#
# - lan:
# timeout: 45
# address:
# - 192.168.0.0/24
# - 192.168.10.0/24
# - 172.16.14.0/24
flow:
memcap: 128mb
hash-size: 65536
prealloc: 10000
emergency-recovery: 30
#managers: 1 # default to one flow manager
#recyclers: 1 # default to one flow recycler thread
# This option controls the use of VLAN ids in the flow (and defrag)
# hashing. Normally this should be enabled, but in some (broken)
# setups where both sides of a flow are not tagged with the same VLAN
# tag, we can ignore the VLAN id's in the flow hashing.
vlan:
use-for-tracking: true
flow-timeouts:
default:
new: 30
established: 300
closed: 0
bypassed: 100
emergency-new: 10
emergency-established: 100
emergency-closed: 0
emergency-bypassed: 50
tcp:
new: 60
established: 600
closed: 60
bypassed: 100
emergency-new: 5
emergency-established: 100
emergency-closed: 10
emergency-bypassed: 50
udp:
new: 30
established: 300
bypassed: 100
emergency-new: 10
emergency-established: 100
emergency-bypassed: 50
icmp:
new: 30
established: 300
bypassed: 100
emergency-new: 10
emergency-established: 100
emergency-bypassed: 50
stream:
memcap: 64mb
checksum-validation: yes # reject incorrect csums
inline: auto # auto will use inline mode in IPS mode, yes or no set it statically
reassembly:
memcap: 256mb
depth: 1mb # reassemble 1mb into a stream
toserver-chunk-size: 2560
toclient-chunk-size: 2560
randomize-chunk-size: yes
#randomize-chunk-range: 10
#raw: yes
#segment-prealloc: 2048
#check-overlap-different-data: true
# Host table:
#
# Host table is used by the tagging and per host thresholding subsystems.
#
host:
hash-size: 4096
prealloc: 1000
memcap: 32mb
# IP Pair table:
#
# Used by xbits 'ippair' tracking.
#
#ippair:
# hash-size: 4096
# prealloc: 1000
# memcap: 32mb
# Decoder settings
decoder:
# Teredo decoder is known to not be completely accurate
# as it will sometimes detect non-teredo as teredo.
teredo:
enabled: true
# ports to look for Teredo. Max 4 ports. If no ports are given, or
# the value is set to 'any', Teredo detection runs on _all_ UDP packets.
ports: $TEREDO_PORTS # syntax: '[3544, 1234]' or '3533' or 'any'.
# VXLAN decoder is assigned to up to 4 UDP ports. By default only the
# IANA assigned port 4789 is enabled.
vxlan:
enabled: true
ports: $VXLAN_PORTS # syntax: '[8472, 4789]' or '4789'.
# Geneve decoder is assigned to up to 4 UDP ports. By default only the
# IANA assigned port 6081 is enabled.
geneve:
enabled: true
ports: $GENEVE_PORTS # syntax: '[6081, 1234]' or '6081'.
# maximum number of decoder layers for a packet
# max-layers: 16
##
## Performance tuning and profiling
##
detect:
profile: medium
custom-values:
toclient-groups: 3
toserver-groups: 25
sgh-mpm-context: auto
inspection-recursion-limit: 3000
prefilter:
default: mpm
grouping:
#tcp-whitelist: 53, 80, 139, 443, 445, 1433, 3306, 3389, 6666, 6667, 8080
#udp-whitelist: 53, 135, 5060
profiling:
grouping:
dump-to-disk: false
include-rules: false # very verbose
include-mpm-stats: false
mpm-algo: auto
# Select the matching algorithm you want to use for single-pattern searches.
#
# Supported algorithms are "bm" (Boyer-Moore) and "hs" (Hyperscan, only
# available if Suricata has been built with Hyperscan support).
#
# The default of "auto" will use "hs" if available, otherwise "bm".
spm-algo: auto
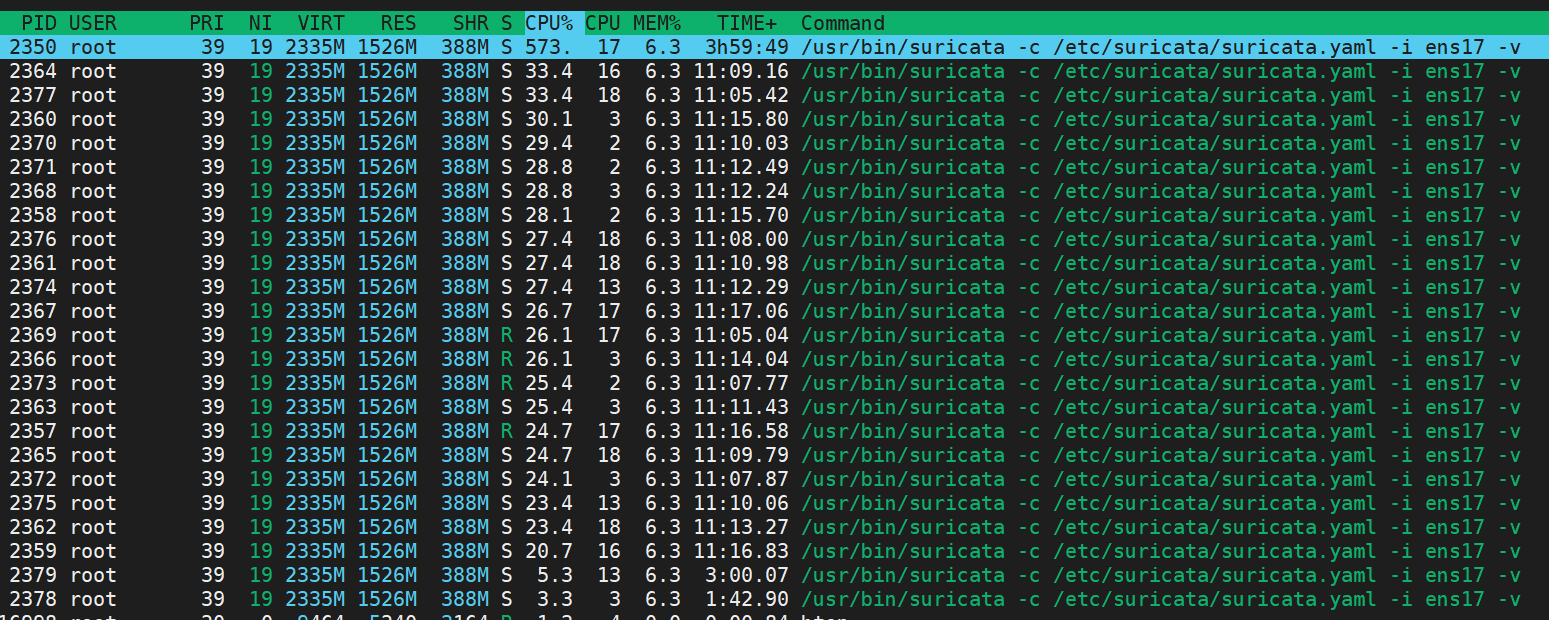
# Suricata is multi-threaded. Here the threading can be influenced.
threading:
set-cpu-affinity: no
# Tune cpu affinity of threads. Each family of threads can be bound
# to specific CPUs.
#
# These 2 apply to the all runmodes:
# management-cpu-set is used for flow timeout handling, counters
# worker-cpu-set is used for 'worker' threads
#
# Additionally, for autofp these apply:
# receive-cpu-set is used for capture threads
# verdict-cpu-set is used for IPS verdict threads
#
cpu-affinity:
- management-cpu-set:
cpu: [ 0, 1, 2 ] # include only these CPUs in affinity settings
- receive-cpu-set:
cpu: [ 0, 1, 2 ] # include only these CPUs in affinity settings
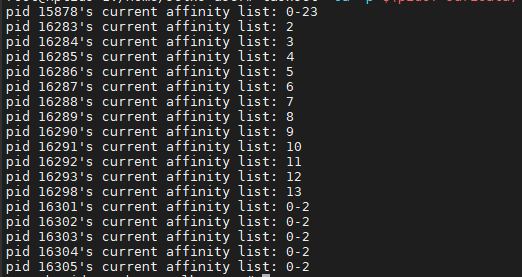
- worker-cpu-set:
cpu: [ "2-14","17-23" ]
mode: "exclusive"
# Use explicitly 3 threads and don't compute number by using
# detect-thread-ratio variable:
# threads: 3
prio:
low: [ 0 ]
medium: [ "1-2" ]
high: [ 3 ]
default: "medium"
#- verdict-cpu-set:
# cpu: [ 0 ]
# prio:
# default: "high"
#
detect-thread-ratio: 0.5
# Luajit has a strange memory requirement, its 'states' need to be in the
# first 2G of the process' memory.
#
# 'luajit.states' is used to control how many states are preallocated.
# State use: per detect script: 1 per detect thread. Per output script: 1 per
# script.
luajit:
states: 128
# Profiling settings. Only effective if Suricata has been built with
# the --enable-profiling configure flag.
#
profiling:
# Run profiling for every X-th packet. The default is 1, which means we
# profile every packet. If set to 1000, one packet is profiled for every
# 1000 received.
#sample-rate: 1000
# rule profiling
rules:
# Profiling can be disabled here, but it will still have a
# performance impact if compiled in.
enabled: yes
filename: rule_perf.log
append: yes
# Sort options: ticks, avgticks, checks, matches, maxticks
# If commented out all the sort options will be used.
#sort: avgticks
# Limit the number of sids for which stats are shown at exit (per sort).
limit: 10
# output to json
json: yes
# per keyword profiling
keywords:
enabled: yes
filename: keyword_perf.log
append: yes
prefilter:
enabled: yes
filename: prefilter_perf.log
append: yes
# per rulegroup profiling
rulegroups:
enabled: yes
filename: rule_group_perf.log
append: yes
# packet profiling
packets:
# Profiling can be disabled here, but it will still have a
# performance impact if compiled in.
enabled: yes
filename: packet_stats.log
append: yes
# per packet csv output
csv:
# Output can be disabled here, but it will still have a
# performance impact if compiled in.
enabled: no
filename: packet_stats.csv
# profiling of locking. Only available when Suricata was built with
# --enable-profiling-locks.
locks:
enabled: no
filename: lock_stats.log
append: yes
pcap-log:
enabled: no
filename: pcaplog_stats.log
append: yes
##
## Netfilter integration
##
nfq:
# mode: accept
# repeat-mark: 1
# repeat-mask: 1
# bypass-mark: 1
# bypass-mask: 1
# route-queue: 2
# batchcount: 20
# fail-open: yes
#nflog support
nflog:
# netlink multicast group
# (the same as the iptables --nflog-group param)
# Group 0 is used by the kernel, so you can't use it
- group: 2
# netlink buffer size
buffer-size: 18432
# put default value here
- group: default
# set number of packets to queue inside kernel
qthreshold: 1
# set the delay before flushing packet in the kernel's queue
qtimeout: 100
# netlink max buffer size
max-size: 20000
##
## Advanced Capture Options
##
# General settings affecting packet capture
capture:
#
netmap:
# To specify OS endpoint add plus sign at the end (e.g. "eth0+")
- interface: eth2
- interface: default
# PF_RING configuration: for use with native PF_RING support
# for more info see http://www.ntop.org/products/pf_ring/
pfring:
- interface: eth0
# Number of receive threads. If set to 'auto' Suricata will first try
# to use CPU (core) count and otherwise RSS queue count.
threads: auto
# Default clusterid. PF_RING will load balance packets based on flow.
# All threads/processes that will participate need to have the same
# clusterid.
cluster-id: 99
# Default PF_RING cluster type. PF_RING can load balance per flow.
# Possible values are cluster_flow or cluster_round_robin.
cluster-type: cluster_flow
# Put default values here
- interface: default
#threads: 2
# For FreeBSD ipfw(8) divert(4) support.
# Please make sure you have ipfw_load="YES" and ipdivert_load="YES"
# in /etc/loader.conf or kldload'ing the appropriate kernel modules.
# Additionally, you need to have an ipfw rule for the engine to see
# the packets from ipfw. For Example:
#
# ipfw add 100 divert 8000 ip from any to any
#
# N.B. This example uses "8000" -- this number must mach the values
# you passed on the command line, i.e., -d 8000
#
ipfw:
napatech:
#
streams: ["0-3"]
# Stream stats can be enabled to provide fine grain packet and byte counters
# for each thread/stream that is configured.
#
enable-stream-stats: no
auto-config: yes
# Enable hardware level flow bypass.
#
hardware-bypass: yes
# Enable inline operation. When enabled traffic arriving on a given port is
# automatically forwarded out its peer port after analysis by Suricata.
#
inline: no
#
ports: [0-1,2-3]
#
hashmode: hash5tuplesorted
##
## Configure Suricata to load Suricata-Update managed rules.
##
default-rule-path: /var/lib/suricata/rules
rule-files:
- suricata.rules
##
## Auxiliary configuration files.
##
classification-file: /etc/suricata/classification.config
reference-config-file: /etc/suricata/reference.config
include: /etc/suricata/additional-config.yaml