Not getting http attack log in suricata 6

Hi,

We have suricata and dc subnet is same with same vlan I’d and we have test vm where we are running vulnerable apps and same apps we have installed on nids machine.

When we are trying to flood icmp for test machine that attack is detected on nids machine and nano is also detected on nids machine for test vm where we have installed vulnerable app.

Now we generating attack for vulnerable app on test vm and attack is not detected on nids machine and when we have run the vulnerable app on nids machine and generating attack for nids vulnerable app it’s detected.

So kindly assist here for http attack.

Note:- ICMP,SNMP and NMAP is detected for test vm except http attack.

So kindly help here and let me know if i forget configure something in suricata.

Thanks in advance!
Ajeet S

Hi,

how does your config look like and how are those VMs connected?
So the attack is seen in one scenario but not the other? so at least the signature is working and must be some sort of configuration related for that setup.

suricata-config.yaml (17.9 KB)
Hi Andreas,

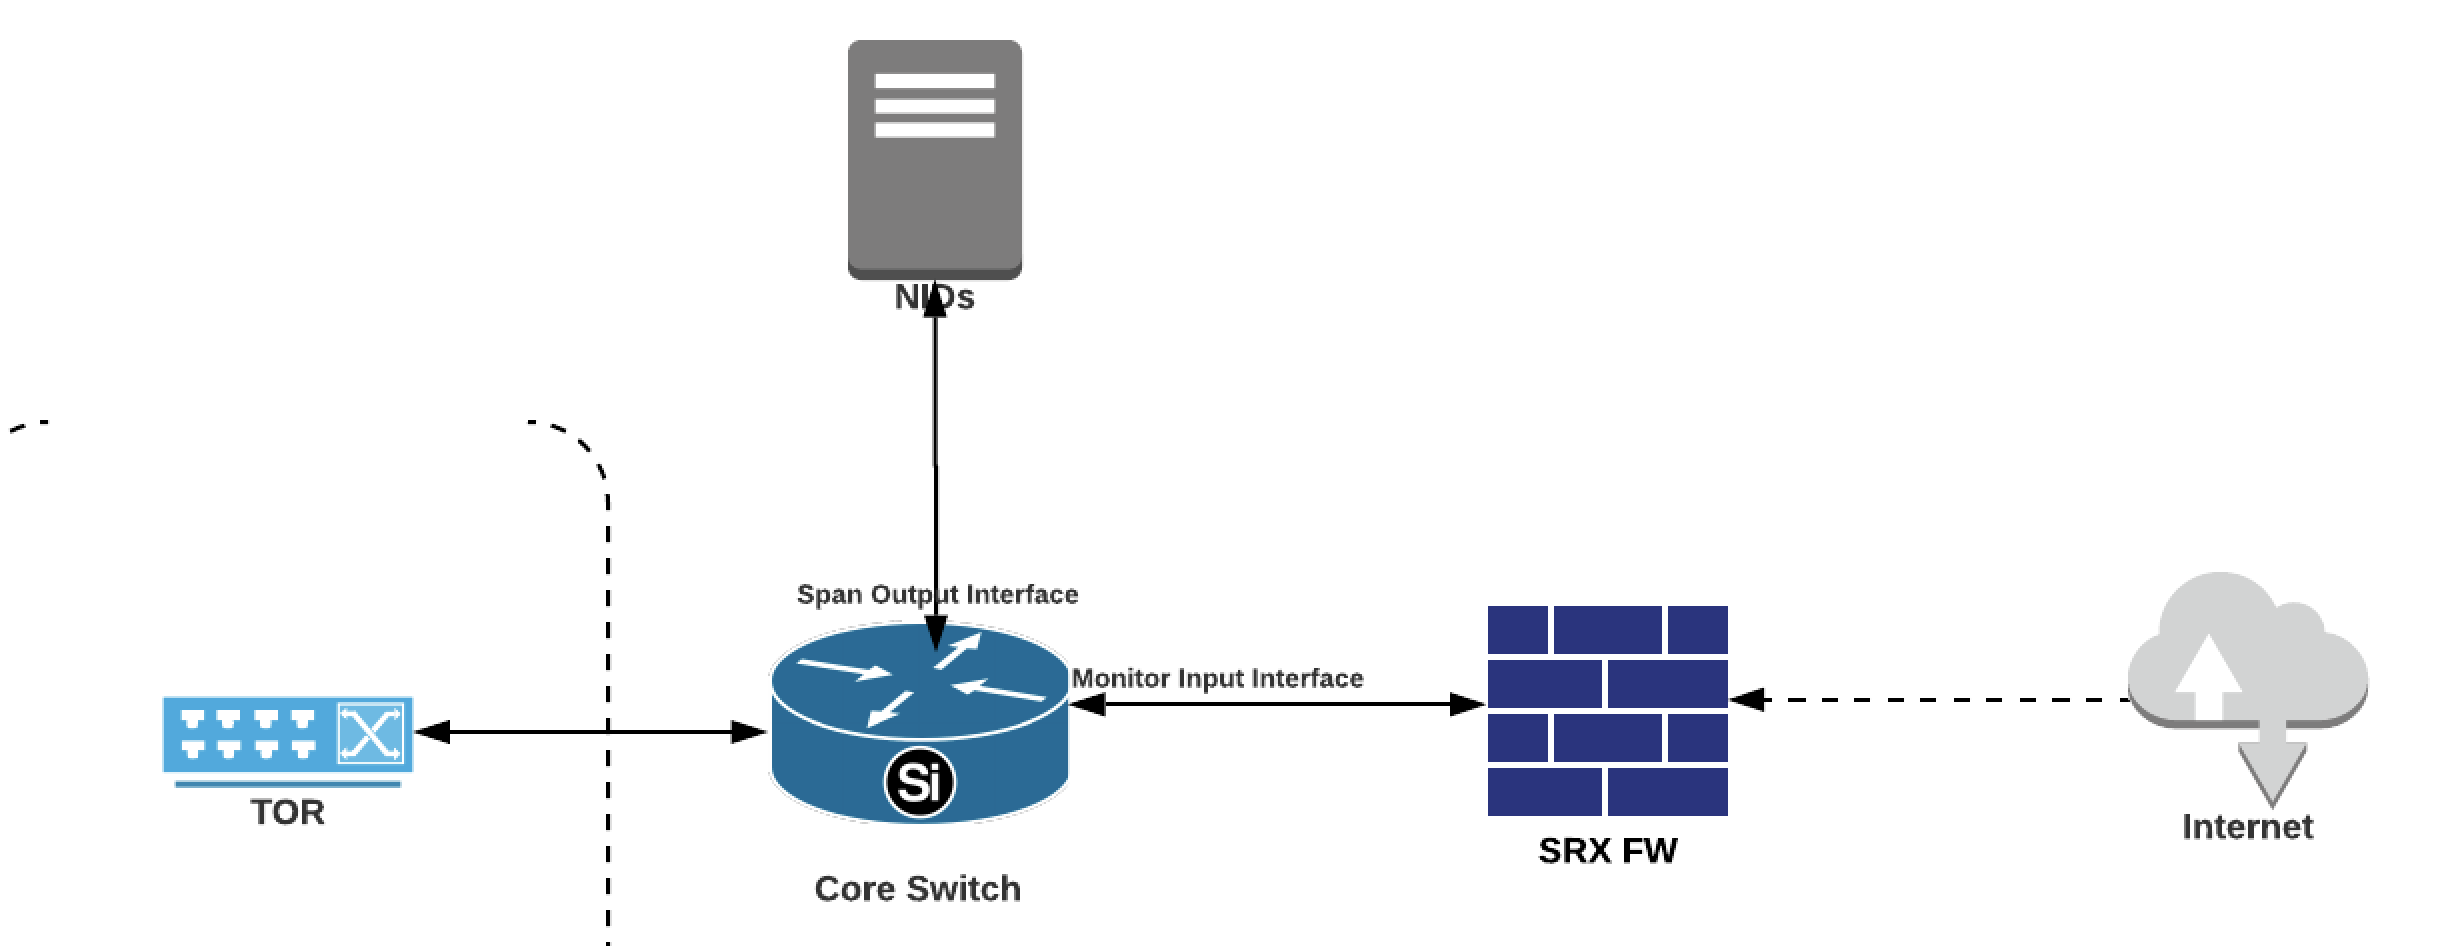
Please have look NIDs vm connectivity arch as well have look for config of suricata.

  1. When we attack http attack on nids vm, it detected with signature
  2. When we attack the different TEST VM which is running same dc same ip pool and same vlan which we have NIDs then that’s not detected for http attack.

When we attack on NIDs vm inside for http attack → Source ip is my local machine (27.62.205.138) from where I am attacking http and NIDs machine ip is 209.10.139.203 where suricata installed as well installed vulnerable apps for http attack test
Output is →

02/11/2022-06:52:28.152274 [] [1:2019232:7] ET WEB_SERVER Possible CVE-2014-6271 Attempt in Headers [] [Classification: Attempted Administrator Privilege Gain] [Priority: 1] {TCP} 27.62.205.138 :11886 → 209.10.139.203:8080

02/11/2022-06:52:28.152939 [] [1:2002034:12] ET ATTACK_RESPONSE Possible /etc/passwd via HTTP (linux style) [] [Classification: Information Leak] [Priority: 2] {TCP} 209.10.139.203:8080 → 27.62.205.138 :11886

02/11/2022-06:52:29.929445 [] [1:2019232:7] ET WEB_SERVER Possible CVE-2014-6271 Attempt in Headers [] [Classification: Attempted Administrator Privilege Gain] [Priority: 1] {TCP} 27.62.205.138 :11887 → 209.10.139.203:8080

02/11/2022-06:52:29.930265 [] [1:2002034:12] ET ATTACK_RESPONSE Possible /etc/passwd via HTTP (linux style) [] [Classification: Information Leak] [Priority: 2] {TCP} 209.10.139.203:8080 → 27.62.205.138 :11887

02/11/2022-06:52:34.704194 [] [1:2019232:7] ET WEB_SERVER Possible CVE-2014-6271 Attempt in Headers [] [Classification: Attempted Administrator Privilege Gain] [Priority: 1] {TCP} 27.62.205.138 :11891 → 209.10.139.203:8080

02/11/2022-06:52:34.727376 [] [1:2002034:12] ET ATTACK_RESPONSE Possible /etc/passwd via HTTP (linux style) [] [Classification: Information Leak] [Priority: 2] {TCP} 209.10.139.203:8080 → 27.62.205.138 :11891


When we attack on Test vm in same dc where NIDs installed copying span traffic for http attack → Source ip is my local machine (27.62.205.138) from where I am attacking http and test machine ip is 209.10.139.204 where vulnerable apps installed for http attack test.
Output is →

When I tried to attack from local machine to test vm then thats not detected logs in fast log and now i am sending here for eve.json log for reference when i attack from local machine to test vm inside for http attack.


{“timestamp”:“2022-02-11T06:59:58.483758+0000”,“flow_id”:1650313413526165,“in_iface”:“ens192”,“event_type”:“flow”,“vlan”:[3],“src_ip”:" 27.62.205.138 ",“src_port”:11949,“dest_ip”:“209.10.139.204”,“dest_port”:8080,“proto”:“TCP”,“flow”:{“pkts_toserver”:6,“pkts_toclient”:0,“bytes_toserver”:551,“bytes_toclient”:0,“start”:“2022-02-11T06:57:12.524949+0000”,“end”:“2022-02-11T06:57:13.759201+0000”,“age”:1,“state”:“new”,“reason”:“timeout”,“alerted”:false},“tcp”:{“tcp_flags”:“1b”,“tcp_flags_ts”:“1b”,“tcp_flags_tc”:“00”,“syn”:true,“fin”:true,“psh”:true,“ack”:true,“state”:“syn_sent”}}

{“timestamp”:“2022-02-11T07:00:01.308051+0000”,“flow_id”:1897203153661722,“in_iface”:“ens192”,“event_type”:“flow”,“vlan”:[3],“src_ip”:" 27.62.205.138 ",“src_port”:12170,“dest_ip”:“209.10.139.204”,“dest_port”:22,“proto”:“TCP”,“flow”:{“pkts_toserver”:15,“pkts_toclient”:0,“bytes_toserver”:1298,“bytes_toclient”:0,“start”:“2022-02-11T06:54:02.159514+0000”,“end”:“2022-02-11T06:59:00.934468+0000”,“age”:298,“state”:“new”,“reason”:“timeout”,“alerted”:false},“tcp”:{“tcp_flags”:“00”,“tcp_flags_ts”:“00”,“tcp_flags_tc”:“00”}}

{“timestamp”:“2022-02-11T07:00:03.145203+0000”,“flow_id”:1793821155596519,“in_iface”:“ens192”,“event_type”:“flow”,“vlan”:[99],“src_ip”:“209.10.139.204”,“src_port”:8080,“dest_ip”:" 27.62.205.138 ",“dest_port”:11947,“proto”:“TCP”,“flow”:{“pkts_toserver”:6,“pkts_toclient”:0,“bytes_toserver”:1299,“bytes_toclient”:0,“start”:“2022-02-11T06:57:09.661735+0000”,“end”:“2022-02-11T06:57:10.344741+0000”,“age”:1,“state”:“new”,“reason”:“timeout”,“alerted”:false},“tcp”:{“tcp_flags”:“00”,“tcp_flags_ts”:“00”,“tcp_flags_tc”:“00”}}

{“timestamp”:“2022-02-11T07:00:05.100368+0000”,“flow_id”:2009185855278980,“in_iface”:“ens192”,“event_type”:“flow”,“vlan”:[3],“src_ip”:" 27.62.205.138 ",“src_port”:11987,“dest_ip”:“209.10.139.204”,“dest_port”:8080,“proto”:“TCP”,“flow”:{“pkts_toserver”:6,“pkts_toclient”:0,“bytes_toserver”:551,“bytes_toclient”:0,“start”:“2022-02-11T06:58:57.135044+0000”,“end”:“2022-02-11T06:58:58.439133+0000”,“age”:1,“state”:“new”,“reason”:“timeout”,“alerted”:false},“tcp”:{“tcp_flags”:“1b”,“tcp_flags_ts”:“1b”,“tcp_flags_tc”:“00”,“syn”:true,“fin”:true,“psh”:true,“ack”:true,“state”:“syn_sent”}}

{“timestamp”:“2022-02-11T07:00:05.163979+0000”,“flow_id”:1974250591078075,“in_iface”:“ens192”,“event_type”:“flow”,“vlan”:[3],“src_ip”:" 27.62.205.138 ",“src_port”:11986,“dest_ip”:“209.10.139.204”,“dest_port”:8080,“proto”:“TCP”,“flow”:{“pkts_toserver”:7,“pkts_toclient”:0,“bytes_toserver”:617,“bytes_toclient”:0,“start”:“2022-02-11T06:58:53.902843+0000”,“end”:“2022-02-11T06:58:54.944103+0000”,“age”:1,“state”:“new”,“reason”:“timeout”,“alerted”:false},“tcp”:{“tcp_flags”:“1b”,“tcp_flags_ts”:“1b”,“tcp_flags_tc”:“00”,“syn”:true,“fin”:true,“psh”:true,“ack”:true,“state”:“syn_sent”}}

{“timestamp”:“2022-02-11T07:00:09.150345+0000”,“flow_id”:1515900264702435,“in_iface”:“ens192”,“event_type”:“flow”,“vlan”:[99],“src_ip”:“209.10.139.204”,“src_port”:8080,“dest_ip”:" 27.62.205.138 ",“dest_port”:11950,“proto”:“TCP”,“flow”:{“pkts_toserver”:6,“pkts_toclient”:0,“bytes_toserver”:1299,“bytes_toclient”:0,“start”:“2022-02-11T06:57:14.057827+0000”,“end”:“2022-02-11T06:57:14.892518+0000”,“age”:0,“state”:“new”,“reason”:“timeout”,“alerted”:false},“tcp”:{“tcp_flags”:“00”,“tcp_flags_ts”:“00”,“tcp_flags_tc”:“00”}}

{“timestamp”:“2022-02-11T07:00:10.482107+0000”,“flow_id”:390528646097599,“in_iface”:“ens192”,“event_type”:“flow”,“vlan”:[99],“src_ip”:“209.10.139.204”,“src_port”:8080,“dest_ip”:" 27.62.205.138 ",“dest_port”:11994,“proto”:“TCP”,“flow”:{“pkts_toserver”:6,“pkts_toclient”:0,“bytes_toserver”:1299,“bytes_toclient”:0,“start”:“2022-02-11T06:59:05.961215+0000”,“end”:“2022-02-11T06:59:06.658103+0000”,“age”:1,“state”:“new”,“reason”:“timeout”,“alerted”:false},“tcp”:{“tcp_flags”:“00”,“tcp_flags_ts”:“00”,“tcp_flags_tc”:“00”}}

{“timestamp”:“2022-02-11T07:00:12.485291+0000”,“flow_id”:1095442300258421,“in_iface”:“ens192”,“event_type”:“flow”,“vlan”:[99],“src_ip”:“209.10.139.204”,“src_port”:8080,“dest_ip”:" 27.62.205.138 ",“dest_port”:11986,“proto”:“TCP”,“flow”:{“pkts_toserver”:6,“pkts_toclient”:0,“bytes_toserver”:1299,“bytes_toclient”:0,“start”:“2022-02-11T06:58:53.903285+0000”,“end”:“2022-02-11T06:58:54.603277+0000”,“age”:1,“state”:“new”,“reason”:“timeout”,“alerted”:false},“tcp”:{“tcp_flags”:“00”,“tcp_flags_ts”:“00”,“tcp_flags_tc”:“00”}}

{“timestamp”:“2022-02-11T07:00:14.988024+0000”,“flow_id”:247418190490192,“in_iface”:“ens192”,“event_type”:“flow”,“vlan”:[3],“src_ip”:" 27.62.205.138 ",“dest_ip”:“209.10.139.204”,“proto”:“ICMP”,“icmp_type”:8,“icmp_code”:0,“flow”:{“pkts_toserver”:2,“pkts_toclient”:0,“bytes_toserver”:196,“bytes_toclient”:0,“start”:“2022-02-11T06:59:38.518736+0000”,“end”:“2022-02-11T06:59:39.514919+0000”,“age”:1,“state”:“new”,“reason”:“timeout”,“alerted”:true}}

{“timestamp”:“2022-02-11T07:00:15.775089+0000”,“flow_id”:35656973375260,“in_iface”:“ens192”,“event_type”:“flow”,“vlan”:[99],“src_ip”:“209.10.139.204”,“src_port”:8080,“dest_ip”:" 27.62.205.138 ",“dest_port”:12000,“proto”:“TCP”,“flow”:{“pkts_toserver”:6,“pkts_toclient”:0,“bytes_toserver”:1299,“bytes_toclient”:0,“start”:“2022-02-11T06:59:07.481052+0000”,“end”:“2022-02-11T06:59:08.203725+0000”,“age”:1,“state”:“new”,“reason”:“timeout”,“alerted”:false},“tcp”:{“tcp_flags”:“00”,“tcp_flags_ts”:“00”,“tcp_flags_tc”:“00”}}

Now same thing If i tried to attack ICMP and NMAp from local machine to test vm inside which is detected in nids but not http attack.

Output for ICMP and NMAp attack from local machine to test vm---------------------------->

{“timestamp”:“2022-02-11T07:03:12.156324+0000”,“flow_id”:247418204356856,“in_iface”:“ens192”,“event_type”:“alert”,“vlan”:[3],“src_ip”:" 27.62.205.138 ",“src_port”:0,“dest_ip”:“209.10.139.204”,“dest_port”:0,“proto”:“ICMP”,“icmp_type”:8,“icmp_code”:0,“alert”:{“action”:“allowed”,“gid”:1,“signature_id”:2100368,“rev”:7,“signature”:“GPL ICMP_INFO PING BSDtype”,“category”:“Misc activity”,“severity”:3,“metadata”:{“created_at”:[“2010_09_23”],“updated_at”:[“2010_09_23”]}},“flow”:{“pkts_toserver”:3,“pkts_toclient”:0,“bytes_toserver”:294,“bytes_toclient”:0,“start”:“2022-02-11T07:03:10.098552+0000”}}

{“timestamp”:“2022-02-11T07:03:13.112248+0000”,“flow_id”:247418204356856,“in_iface”:“ens192”,“event_type”:“alert”,“vlan”:[3],“src_ip”:" 27.62.205.138 ",“src_port”:0,“dest_ip”:“209.10.139.204”,“dest_port”:0,“proto”:“ICMP”,“icmp_type”:8,“icmp_code”:0,“alert”:{“action”:“allowed”,“gid”:1,“signature_id”:2100368,“rev”:7,“signature”:“GPL ICMP_INFO PING BSDtype”,“category”:“Misc activity”,“severity”:3,“metadata”:{“created_at”:[“2010_09_23”],“updated_at”:[“2010_09_23”]}},“flow”:{“pkts_toserver”:4,“pkts_toclient”:0,“bytes_toserver”:392,“bytes_toclient”:0,“start”:“2022-02-11T07:03:10.098552+0000”}}

{“timestamp”:“2022-02-11T07:03:14.115676+0000”,“flow_id”:247418204356856,“in_iface”:“ens192”,“event_type”:“alert”,“vlan”:[3],“src_ip”:" 27.62.205.138 ",“src_port”:0,“dest_ip”:“209.10.139.204”,“dest_port”:0,“proto”:“ICMP”,“icmp_type”:8,“icmp_code”:0,“alert”:{“action”:“allowed”,“gid”:1,“signature_id”:2100368,“rev”:7,“signature”:“GPL ICMP_INFO PING BSDtype”,“category”:“Misc activity”,“severity”:3,“metadata”:{“created_at”:[“2010_09_23”],“updated_at”:[“2010_09_23”]}},“flow”:{“pkts_toserver”:5,“pkts_toclient”:0,“bytes_toserver”:490,“bytes_toclient”:0,“start”:“2022-02-11T07:03:10.098552+0000”}}

{“timestamp”:“2022-02-11T07:03:15.157895+0000”,“flow_id”:247418204356856,“in_iface”:“ens192”,“event_type”:“alert”,“vlan”:[3],“src_ip”:" 27.62.205.138 ",“src_port”:0,“dest_ip”:“209.10.139.204”,“dest_port”:0,“proto”:“ICMP”,“icmp_type”:8,“icmp_code”:0,“alert”:{“action”:“allowed”,“gid”:1,“signature_id”:2100368,“rev”:7,“signature”:“GPL ICMP_INFO PING BSDtype”,“category”:“Misc activity”,“severity”:3,“metadata”:{“created_at”:[“2010_09_23”],“updated_at”:[“2010_09_23”]}},“flow”:{“pkts_toserver”:6,“pkts_toclient”:0,“bytes_toserver”:588,“bytes_toclient”:0,“start”:“2022-02-11T07:03:10.098552+0000”}}

{“timestamp”:“2022-02-11T07:03:22.719692+0000”,“flow_id”:500649476946764,“in_iface”:“ens192”,“event_type”:“alert”,“vlan”:[3],“src_ip”:" 27.62.205.138 ",“src_port”:12089,“dest_ip”:“209.10.139.204”,“dest_port”:3306,“proto”:“TCP”,“alert”:{“action”:“allowed”,“gid”:1,“signature_id”:2010937,“rev”:3,“signature”:“ET SCAN Suspicious inbound to mySQL port 3306”,“category”:“Potentially Bad Traffic”,“severity”:2,“metadata”:{“created_at”:[“2010_07_30”],“former_category”:[“HUNTING”],“updated_at”:[“2018_03_27”]}},“flow”:{“pkts_toserver”:1,“pkts_toclient”:0,“bytes_toserver”:78,“bytes_toclient”:0,“start”:“2022-02-11T07:03:22.719692+0000”}}

{“timestamp”:“2022-02-11T07:03:23.712045+0000”,“flow_id”:500649476946764,“in_iface”:“ens192”,“event_type”:“alert”,“vlan”:[3],“src_ip”:" 27.62.205.138 ",“src_port”:12089,“dest_ip”:“209.10.139.204”,“dest_port”:3306,“proto”:“TCP”,“alert”:{“action”:“allowed”,“gid”:1,“signature_id”:2010937,“rev”:3,“signature”:“ET SCAN Suspicious inbound to mySQL port 3306”,“category”:“Potentially Bad Traffic”,“severity”:2,“metadata”:{“created_at”:[“2010_07_30”],“former_category”:[“HUNTING”],“updated_at”:[“2018_03_27”]}},“flow”:{“pkts_toserver”:2,“pkts_toclient”:0,“bytes_toserver”:156,“bytes_toclient”:0,“start”:“2022-02-11T07:03:22.719692+0000”}}

{“timestamp”:“2022-02-11T07:03:24.183393+0000”,“flow_id”:1576470065237089,“in_iface”:“ens192”,“event_type”:“alert”,“vlan”:[3],“src_ip”:" 27.62.205.138 ",“src_port”:12094,“dest_ip”:“209.10.139.204”,“dest_port”:3306,“proto”:“TCP”,“alert”:{“action”:“allowed”,“gid”:1,“signature_id”:2010937,“rev”:3,“signature”:“ET SCAN Suspicious inbound to mySQL port 3306”,“category”:“Potentially Bad Traffic”,“severity”:2,“metadata”:{“created_at”:[“2010_07_30”],“former_category”:[“HUNTING”],“updated_at”:[“2018_03_27”]}},“flow”:{“pkts_toserver”:1,“pkts_toclient”:0,“bytes_toserver”:78,“bytes_toclient”:0,“start”:“2022-02-11T07:03:24.183393+0000”}}
suricata-config.yaml (17.9 KB)
Uploading: nids-arch.png…
suricata-config.yaml (17.9 KB)

It’s still a bit hard to follow. Also in the graphic where is your client and where is the test vm that you attack?

Besides that I would run a test against the test vm and the nids where you see the difference with the alerts. Run tcpdump and save the pcap for both scenarios and afterwards compare those and run them against suricata. Maybe there is a difference in how the traffic is forwarded.

Hi Herz,

Please have look my tcpdump for TESt vm and NIDs machine.TEST VM connected with TOR only and I am taking complete span traffic for whole DC to NIDs machine. Client is sitting on Remote location which global Internet.

1.Basically I have installed vulnerable app on test vm as well as NIDs machine and try to attack first on test vm and taken tcpdump on NIDs vm, packet is reaching on NIDs machine for attack which is happened on test vm for vulnerable app but not detected on fast.log and eve.json.
2. Now I have installed vulnerable app on NIDs machine itself and started attack on NIDs vulnerable app and i can see the log in tcpdump which is happened NIDs machine as well and i can see the attack log in fast.log as well as eve.json file.

Now the problem here is both attack packet is reaching on NIDs machine but TEST vm attack is not detected on NIDs machine and NIDs machine itself attack is detected on Fast.log and eve.json.
Please have look the tcpdump log for test vm as well NIDs machine.

My Remote location Source IP - 157.34.192.95

MY NIDs Machine IP = 209.10.139.203

MY Test VM IP = 209.10.139.204

TCPDUMP captured ON NIDS machine:-

  1. First I have taken tcpdump for TEST VM (209.10.139.204) and started attack from remote machine (157.34.192.95) and I. Can see in log packet is reaching on NIDs machine (209.10.139.204) but when I try to see the attack in fast.log and eve.json I can’t see the packet and can see.

  2. Second I have taken tcpdump for NIDs Machine (209.10.139.203) itself and started attack from remote machine (157.34.192.95) and I can see in log packet is reaching on NIDs machine itself as well as I can see attack in fast.log file as well as in eve.json.

Now Can you please help me here what’s problem there in suricate, It require to change some config in suricata.

Tcpdump for TEST VM itself installed vulnerable app inside TEST vm attack for http

15:11:02.008920 IP 157.34.192.95.55632 > 209.10.139.204.webcache: Flags [S], seq 3005712528, win 65535, options [mss 1370,nop,wscale 6,nop,nop,TS val 4014606274 ecr 0,sackOK,eol], length 0

15:11:02.009098 IP 209.10.139.204.webcache > 157.34.192.95.55632: Flags [S.], seq 2947044992, ack 3005712529, win 28960, options [mss 1460,sackOK,TS val 1663020512 ecr 4014606274,nop,wscale 7], length 0

15:11:02.279120 IP 157.34.192.95.55632 > 209.10.139.204.webcache: Flags [.], ack 1, win 2058, options [nop,nop,TS val 4014606538 ecr 1663020512], length 0

15:11:02.288723 IP 157.34.192.95.55632 > 209.10.139.204.webcache: Flags [P.], seq 1:144, ack 1, win 2058, options [nop,nop,TS val 4014606538 ecr 1663020512], length 143: HTTP: GET /cgi-bin/vulnerable HTTP/1.1

15:11:02.288922 IP 209.10.139.204.webcache > 157.34.192.95.55632: Flags [.], ack 144, win 235, options [nop,nop,TS val 1663020792 ecr 4014606538], length 0

15:11:02.291806 IP 209.10.139.204.webcache > 157.34.192.95.55632: Flags [P.], seq 1:123, ack 144, win 235, options [nop,nop,TS val 1663020795 ecr 4014606538], length 122: HTTP: HTTP/1.1 200 OK

15:11:02.294310 IP 209.10.139.204.webcache > 157.34.192.95.55632: Flags [P.], seq 123:891, ack 144, win 235, options [nop,nop,TS val 1663020797 ecr 4014606538], length 768: HTTP

15:11:02.294696 IP 209.10.139.204.webcache > 157.34.192.95.55632: Flags [P.], seq 891:896, ack 144, win 235, options [nop,nop,TS val 1663020797 ecr 4014606538], length 5: HTTP

15:11:02.578771 IP 157.34.192.95.55632 > 209.10.139.204.webcache: Flags [.], ack 123, win 2056, options [nop,nop,TS val 4014606812 ecr 1663020795], length 0

15:11:02.578778 IP 157.34.192.95.55632 > 209.10.139.204.webcache: Flags [.], ack 891, win 2044, options [nop,nop,TS val 4014606812 ecr 1663020797], length 0

15:11:02.578780 IP 157.34.192.95.55632 > 209.10.139.204.webcache: Flags [.], ack 896, win 2047, options [nop,nop,TS val 4014606813 ecr 1663020797], length 0

15:11:02.578781 IP 157.34.192.95.55632 > 209.10.139.204.webcache: Flags [F.], seq 144, ack 896, win 2048, options [nop,nop,TS val 4014606813 ecr 1663020797], length 0

15:11:02.579134 IP 209.10.139.204.webcache > 157.34.192.95.55632: Flags [F.], seq 896, ack 145, win 235, options [nop,nop,TS val 1663021082 ecr 4014606813], length 0

15:11:02.878594 IP 157.34.192.95.55632 > 209.10.139.204.webcache: Flags [.], ack 897, win 2048, options [nop,nop,TS val 4014607090 ecr 1663021082], length 0

15:11:04.534900 IP 45.155.205.48.44999 > 209.10.139.204.auris: Flags [S], seq 802413072, win 1024, length 0

15:11:04.534901 IP 209.10.139.204.auris > 45.155.205.48.44999: Flags [R.], seq 0, ack 802413073, win 0, length 0

15:11:04.657458 IP 45.155.205.48.44999 > 209.10.139.204.auris: Flags [R], seq 802413073, win 1200, length 0

15:11:05.359579 IP 157.34.192.95.55633 > 209.10.139.204.webcache: Flags [S], seq 1770084606, win 65535, options [mss 1370,nop,wscale 6,nop,nop,TS val 3240256382 ecr 0,sackOK,eol], length 0

15:11:05.360039 IP 209.10.139.204.webcache > 157.34.192.95.55633: Flags [S.], seq 476258435, ack 1770084607, win 28960, options [mss 1460,sackOK,TS val 1663023863 ecr 3240256382,nop,wscale 7], length 0

15:11:05.640088 IP 157.34.192.95.55633 > 209.10.139.204.webcache: Flags [.], ack 1, win 2058, options [nop,nop,TS val 3240256653 ecr 1663023863], length 0

15:11:05.659242 IP 157.34.192.95.55633 > 209.10.139.204.webcache: Flags [P.], seq 1:144, ack 1, win 2058, options [nop,nop,TS val 3240256653 ecr 1663023863], length 143: HTTP: GET /cgi-bin/vulnerable HTTP/1.1

15:11:05.659450 IP 209.10.139.204.webcache > 157.34.192.95.55633: Flags [.], ack 144, win 235, options [nop,nop,TS val 1663024162 ecr 3240256653], length 0

15:11:05.662944 IP 209.10.139.204.webcache > 157.34.192.95.55633: Flags [P.], seq 1:123, ack 144, win 235, options [nop,nop,TS val 1663024165 ecr 3240256653], length 122: HTTP: HTTP/1.1 200 OK

15:11:05.664686 IP 209.10.139.204.webcache > 157.34.192.95.55633: Flags [P.], seq 123:891, ack 144, win 235, options [nop,nop,TS val 1663024167 ecr 3240256653], length 768: HTTP

15:11:05.664691 IP 209.10.139.204.webcache > 157.34.192.95.55633: Flags [P.], seq 891:896, ack 144, win 235, options [nop,nop,TS val 1663024168 ecr 3240256653], length 5: HTTP

15:11:05.934096 IP 157.34.192.95.55633 > 209.10.139.204.webcache: Flags [.], ack 123, win 2056, options [nop,nop,TS val 3240256941 ecr 1663024165], length 0

15:11:05.934130 IP 157.34.192.95.55633 > 209.10.139.204.webcache: Flags [.], ack 896, win 2044, options [nop,nop,TS val 3240256944 ecr 1663024168], length 0

15:11:05.934136 IP 157.34.192.95.55633 > 209.10.139.204.webcache: Flags [F.], seq 144, ack 896, win 2048, options [nop,nop,TS val 3240256944 ecr 1663024168], length 0

15:11:05.934353 IP 209.10.139.204.webcache > 157.34.192.95.55633: Flags [F.], seq 896, ack 145, win 235, options [nop,nop,TS val 1663024437 ecr 3240256944], length 0

15:11:06.199352 IP 157.34.192.95.55633 > 209.10.139.204.webcache: Flags [.], ack 897, win 2048, options [nop,nop,TS val 3240257210 ecr 1663024437], length 0

Tcpdump for NIDS itself installed vulnerable app inside NIDS vm attack for http

15:15:54.685242 IP 157.34.192.95.44042 > nids-security-001-dcm-use1d-prod.bstack-internal.com.webcache: Flags [.], ack 1, win 2058, options [nop,nop,TS val 181087507 ecr 2075526601], length 0

15:15:54.685286 IP 157.34.192.95.44042 > nids-security-001-dcm-use1d-prod.bstack-internal.com.webcache: Flags [.], ack 1, win 2058, options [nop,nop,TS val 181087507 ecr 2075526601], length 0

15:15:54.685290 IP 157.34.192.95.44042 > nids-security-001-dcm-use1d-prod.bstack-internal.com.webcache: Flags [P.], seq 1:144, ack 1, win 2058, options [nop,nop,TS val 181087507 ecr 2075526601], length 143: HTTP: GET /cgi-bin/vulnerable HTTP/1.1

15:15:54.685299 IP 157.34.192.95.44042 > nids-security-001-dcm-use1d-prod.bstack-internal.com.webcache: Flags [P.], seq 1:144, ack 1, win 2058, options [nop,nop,TS val 181087507 ecr 2075526601], length 143: HTTP: GET /cgi-bin/vulnerable HTTP/1.1

15:15:54.685355 IP nids-security-001-dcm-use1d-prod.bstack-internal.com.webcache > 157.34.192.95.44042: Flags [.], ack 144, win 235, options [nop,nop,TS val 2075526880 ecr 181087507], length 0

15:15:54.685576 IP nids-security-001-dcm-use1d-prod.bstack-internal.com.webcache > 157.34.192.95.44042: Flags [.], ack 144, win 235, options [nop,nop,TS val 2075526880 ecr 181087507], length 0

15:15:54.688071 IP nids-security-001-dcm-use1d-prod.bstack-internal.com.webcache > 157.34.192.95.44042: Flags [P.], seq 1:123, ack 144, win 235, options [nop,nop,TS val 2075526883 ecr 181087507], length 122: HTTP: HTTP/1.1 200 OK

15:15:54.688212 IP nids-security-001-dcm-use1d-prod.bstack-internal.com.webcache > 157.34.192.95.44042: Flags [P.], seq 1:123, ack 144, win 235, options [nop,nop,TS val 2075526883 ecr 181087507], length 122: HTTP: HTTP/1.1 200 OK

15:15:54.690733 IP nids-security-001-dcm-use1d-prod.bstack-internal.com.webcache > 157.34.192.95.44042: Flags [P.], seq 123:891, ack 144, win 235, options [nop,nop,TS val 2075526885 ecr 181087507], length 768: HTTP

15:15:54.690906 IP nids-security-001-dcm-use1d-prod.bstack-internal.com.webcache > 157.34.192.95.44042: Flags [P.], seq 123:891, ack 144, win 235, options [nop,nop,TS val 2075526885 ecr 181087507], length 768: HTTP

15:15:54.691139 IP nids-security-001-dcm-use1d-prod.bstack-internal.com.webcache > 157.34.192.95.44042: Flags [P.], seq 891:896, ack 144, win 235, options [nop,nop,TS val 2075526886 ecr 181087507], length 5: HTTP

15:15:54.691312 IP nids-security-001-dcm-use1d-prod.bstack-internal.com.webcache > 157.34.192.95.44042: Flags [P.], seq 891:896, ack 144, win 235, options [nop,nop,TS val 2075526886 ecr 181087507], length 5: HTTP

Hi Herz,

When I changed the config in suricata.yaml and enable below config, I am able to see the http attack for start few attack and after that i cant see the attack as well as when i am restarting the Suricata service i can see below attack responce but when i restart the Suricata services.

I don’t whats happening in Suricata machine and what need to be Change in Suricata for this issue.

02/14/2022-08:16:47.154977 [] [1:2221010:1] SURICATA HTTP unable to match response to request [] [Classification: Generic Protocol Command Decode] [Priority: 3] {TCP} 209.10.139.204:8080 → 157.34.218.213 :55641

02/14/2022-08:16:47.154977 [] [1:2002034:12] ET ATTACK_RESPONSE Possible /etc/passwd via HTTP (linux style) [] [Classification: Information Leak] [Priority: 2] {TCP} 209.10.139.204:8080 → 157.34.218.21 :55641

02/14/2022-08:16:47.839147 [] [1:2221010:1] SURICATA HTTP unable to match response to request [] [Classification: Generic Protocol Command Decode] [Priority: 3] {TCP} 209.10.139.204:8080 → 157.34.218.213 :55640

02/14/2022-08:16:47.839147 [] [1:2002034:12] ET ATTACK_RESPONSE Possible /etc/passwd via HTTP (linux style) [] [Classification: Information Leak] [Priority: 2] {TCP} 209.10.139.204:8080 → 157.34.218.21 :55640

02/14/2022-08:16:47.872610 [] [1:2019232:7] ET WEB_SERVER Possible CVE-2014-6271 Attempt in Headers [] [Classification: Attempted Administrator Privilege Gain] [Priority: 1] {TCP} 157.34.218.213 :55638 → 209.10.139.204:8080

stream :

memcap : 512mb

checksum-validation : no # reject wrong csums

inline : no # auto will use inline mode in IPS mode, yes or no set it statically

midstream : true

async-oneside : true

Can you please help what we can change in suricata.yaml file.

Cheers,
Ajeet S